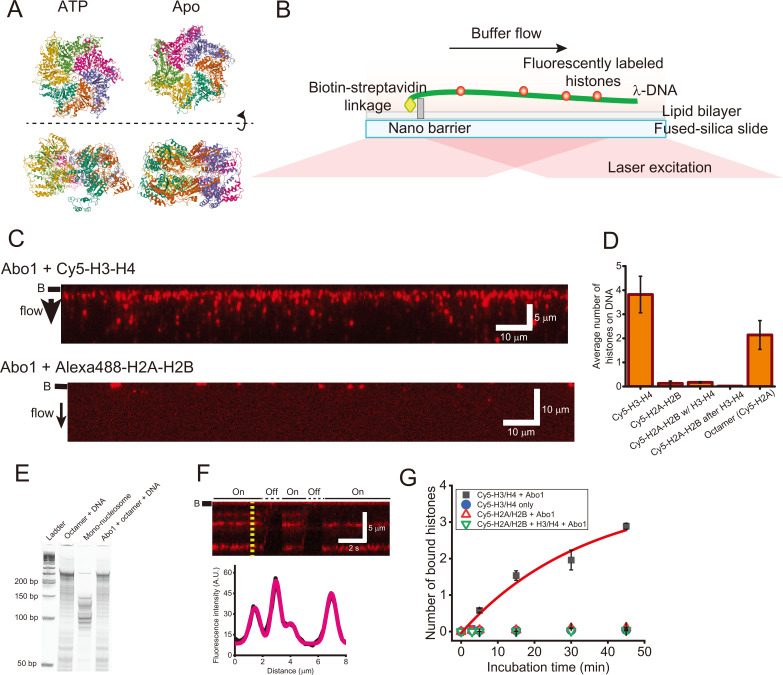
Fig. 1. DNA curtain assay for histone assembly by Abo1.
(A) Cryo-EM structures of Abo1 in the presence of ATP (PDB ID: 6JQ0) (left) and apo (PDB ID: 6JPU) (right) (Cho et al., 2019). Top view (top) and side view (bottom). (B) Schematic of the single-tethered DNA curtain assay (side view). Only one end of the λ-DNA is tagged with biotin, which is anchored on a biotinylated lipid molecule via streptavidin. In the presence of flow, λ-DNA molecules are aligned at a nano-barrier and extend within the evanescent field. Fluorescently labeled histones bound to DNA are visible only when the flow is on. (C) Images of the DNA curtain for the loading of Cy5-labeled H3-H4 dimers (top) and Alexa488-H2A-H2B dimers (bottom). Red puncta represent fluorescently labeled histones. The black bar next to each image represents the nano-barrier position. The black arrow indicates the flow direction. (D) Quantitative analysis for histone loading onto DNA by Abo1. Abo1 does not load H2A-H2B dimers onto DNA even in the presence of H3-H4 dimers. Abo1 also loads histone octamers, but the loading efficiency is half that for H3-H4 dimers. More than 500 DNA molecules were analyzed for each case. (E) Micrococcal nuclease assay to test Abo1-mediated nucleosome formation of histone octamers. (F) (Top) Kymograph of the single DNA molecule in (C). Whenever flow is turned off, the fluorescence signals disappear, ensuring that H3-H4 dimers bind to DNA. “On” (solid line) and “Off” (dashed line) above the kymograph represent flow-on and flow-off, respectively. The black bar next to the image represents the nano-barrier position. (Bottom) Fluorescence intensity profile at the yellow dashed line in the kymograph above. The profile is fitted using multiple Gaussian functions (magenta). (G) Histone loading kinetics by Abo1. More H3-H4 dimers are loaded by Abo1 over time. In the absence of Abo1, H3-H4 is rarely loaded. Abo1 does not deposit H2A-H2B dimers regardless of H3-H4. Black-filled square: Cy5-H3-H4 dimers with Abo1. Blue-filled circle: Cy5-H3-H4 alone. Red empty triangle: Cy5-H2A-H2B with Abo1. Green reverse empty triangle: Cy5-H2A-H2B along with unlabeled H3-H4 and Abo1. The red line is a fitting with exponential function (A(1−exp(−t/t 0))), and the characteristic time (t 0) is given as 34 min.

