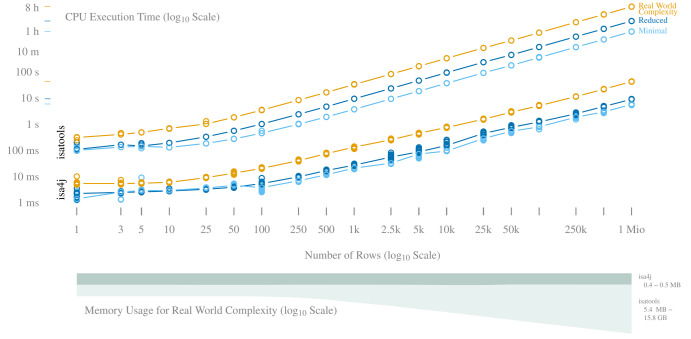
Figure 2. Performance comparison of isa4j and isatools.
Top: CPU execution time at 3 different row complexity levels; Real World complexity was modelled after MIAPPE v1.1 compliant ISA-Tab metadata generated for a plant phenotyping experiment. Small colored lines on the left mark the highest point of each curve to help estimate the maximum value. Bottom: Memory consumption for isa4j and isatools along the same x-axis.

