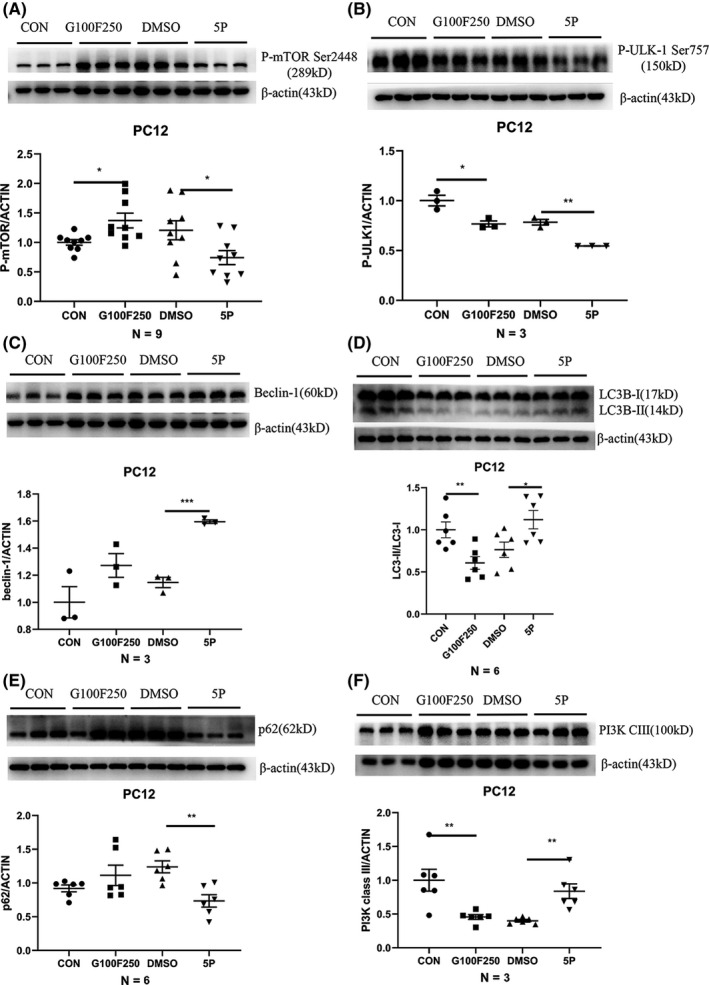
FIGURE 3.

Autophagy‐related proteins in PC12 cells after 24 h 5‐PAHSA treatment. Phosphorylation of m‐TOR at Ser2448 (A), Phosphorylation of ULK‐1 at Ser757 (B), beclin‐1 (C), LC3B II/I (D), SQSTM/p62 (E), PI3 K class III (F). Data are mean ± SEM. n = 9 for A, n = 6 for D and E, n = 3 for B, C and F. *p < 0.05, **p < 0.01, ***p < 0.001 (A–F: unpaired t test)
