Figure 3.
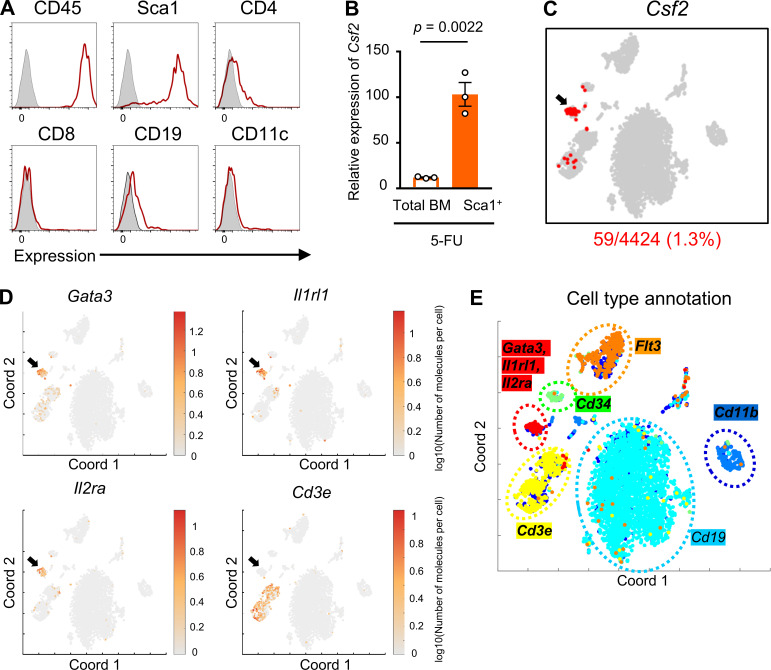
The BM Csf2-positive cluster is composed of ILC2s. (A) Histograms of surface markers in GM-CSF+ BM cells from 5-FU–treated WT mice. The tinted lines show the background level. Results shown are representative of two independent experiments. (B) qRT-PCR analyses for the expression of Csf2 in total BM cells and Sca1+ BM cells from 5-FU–treated mice; n = 3, representative of two independent experiments. Bars indicate expression level relative to that in total BM cells at day 0. (C–E) Single-cell RNA-seq analysis of Sca1+ BMMNCs sorted from 5-FU–treated WT mice. (C) t-SNE projection highlighting Csf2 expressing cells (number of detected mRNA molecules >0). The arrow shows a cluster expressing Csf2. (D) t-SNE projection of the expression pattern for Gata3, Il1rl1, Il2ra, and Cd3e. The color of each cell represents the log10(number of molecules per cell). The arrows are in the same position as in C. (E) Six main clusters generated by t-SNE analysis. Each cluster expressed Cd11b, Cd19, Cd34, Cd3e, Flt3, and a combination of Gata3, Il1rl1, and Il2ra. For the 5-FU–treated mice groups, mice were injected intravenously with 200 mg/kg 5-FU 2 d before being euthanized (A–E). Results are shown as mean ± SEM, and each dot represents an individual mouse. Statistical significance was determined by unpaired Student’s t test (B). Coord, t-SNE coordinate.

