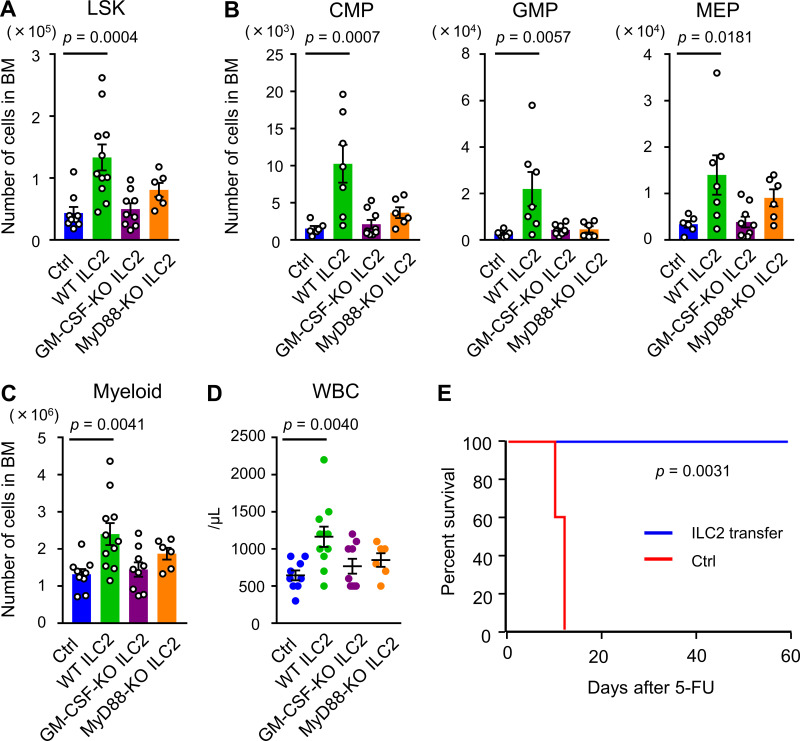
Figure 8.
BM ILC2s from WT mice rescue lethality of GM-CSF–KO mice by 5-FU. (A–D) GM-CSF–KO mice were treated with 150 mg/kg 5-FU. Then, 2 × 10⁵ ILC2s from WT, GM-CSF–KO, or MyD88-KO mice were intravenously injected on days 1 and 2. Control (Ctrl) mice were injected with PBS. The numbers of LSK (A), CMPs, GMPs, and MEPs (B), and Gr1+ or CD11b+ myeloid cells (C) from femurs and tibias, and WBC count in PB (D) were analyzed on day 7; n = 6–9 in control, n = 7–11 in WT ILC2s, n = 9 in GM-CSF–KO ILC2s, and n = 6 in MyD88-KO ILC2s. Data are pooled from two independent experiments. (E) Kaplan–Meier survival curves. GM-CSF–KO mice were treated with a single dose of 200 mg/kg 5-FU. In the ILC2 rescue group, mice were transferred with 2 × 10⁵ ILC2s from WT mice on days 1 and 2 (blue line). Control mice were injected with PBS (red line); n = 5, representative oftwo independent experiments. In the bar charts, the results are shown as mean ± SEM, and each dot represents an individual mouse. Statistical significance was determined by ANOVA with the Bonferroni post hoc test (A–D) or the log-rank test (E).

