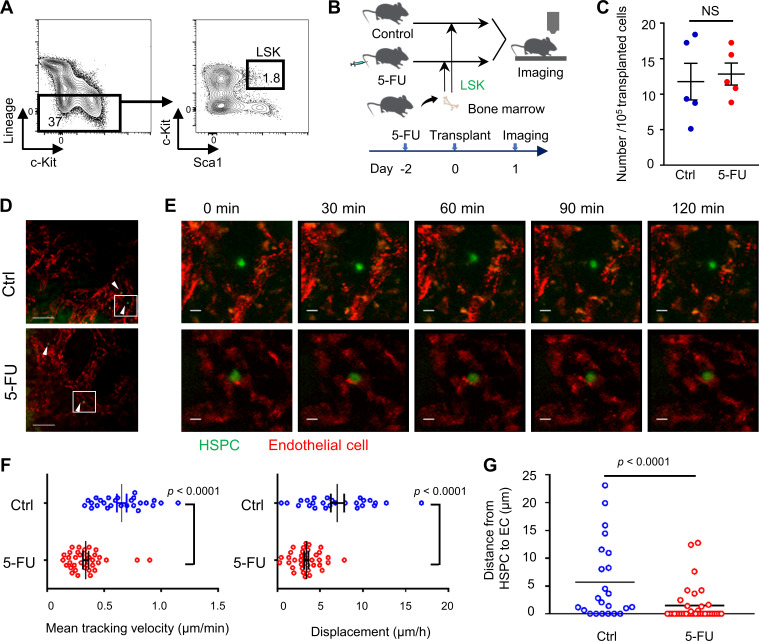
Figure S1.
Myelosuppressive BM environments influence the behavior of HSPCs. (A–G) LSK cells, which were sorted from WT mice and labeled with green dye CMFDA, were transplanted into steady-state (control [Ctrl]) or conditioned mice treated with 5-FU 2 d before transplantation. On the day following transplantation, in vivo two-photon microscopic imaging of skull BM was performed. (A) Sorting strategy of LSK cells. (B) Schematic of the procedure. (C) The number of HSPCs per 105 transplanted cells in visualized skull bone area of control and 5-FU–treated recipient mice (n = 5 each). Results are shown as mean ± SEM. (D) Representative snapshots. Green (arrowhead) and red cells are HSPCs and ECs, respectively. Scale bars, 100 µm. (E) Magnified images from the outlined region in D. Scale bars, 10 µm. See also Video 1 and Video 2. (F) Three-dimensional motility of each transplanted cell was calculated. Results are shown as mean ± SEM, and each dot represents speed (μm/min) or displacement (μm/h) of an individual cell (n = 26 from seven experiments in control; n = 36 from five experiments in 5-FU). (G) The maximum distance from EC to each HSPC during 2-h live imaging (n = 23 from nine experiments in control; n = 36 from seven experiments in 5-FU). Results are shown as mean. Each dot represents an individual cell. Statistical significance was determined by unpaired Student’s t test (C, F, and G).

