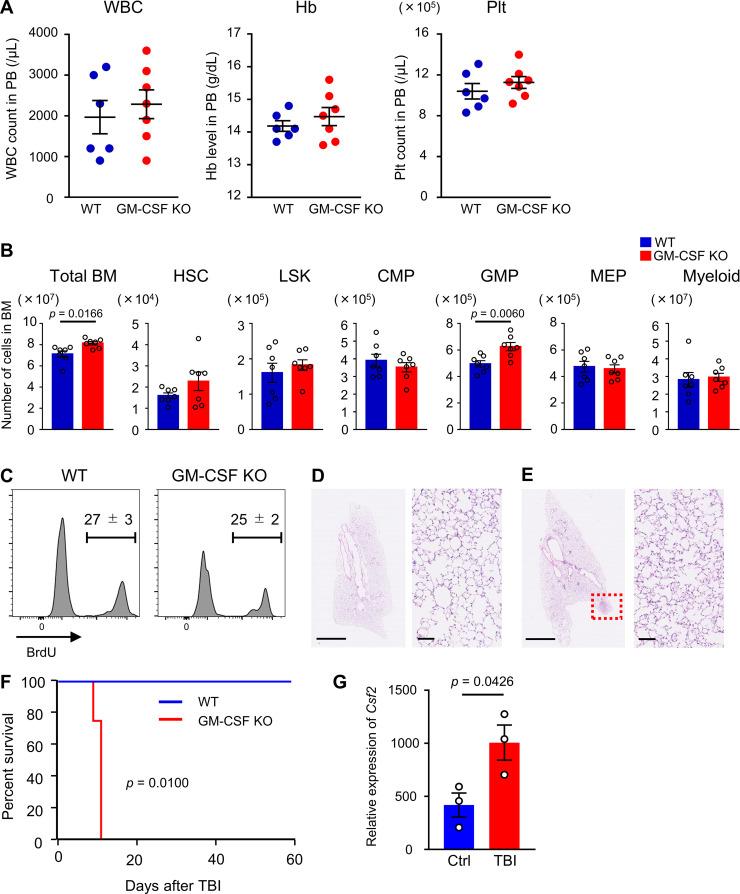
Figure S3.
Phenotype of GM-CSF–KO mice. (A and B) PB and BM cellularity in WT and GM-CSF–KO mice in the steady-state. (A) WBC, hemoglobin (Hb), and platelet (Plt) counts in PB; n = 6 in WT, n = 7 in GM-CSF–KO. Data are pooled from two independent experiments. (B) The numbers of total BM cells, HSCs (CD48−CD150+ LSK cells), LSK cells, CMPs, GMPs, MEPs, and Gr1+ or CD11b+ myeloid cells from femurs and tibias; n = 7, pooled from two independent experiments. (C) BrdU incorporation in LSK cells from WT and GM-CSF–KO mice; n = 3, representative of two independent experiments. (D and E) Lung tissues from 5-FU–treated (200 mg/kg) WT and GM-CSF–KO mice at day 5 were dissected after perfusion-fixation with 4% PFA. Dissected tissues were further fixed in 4% PFA overnight and embedded in paraffin. Sections from WT (D) and GM-CSF–KO (E) mice stained with hematoxylin and eosin are shown. Scale bars, 2.5 mm in left panels, 100 µm in right panels. Dotted red square in E shows tubercule composed of eosinophilic protein. (F) Kaplan–Meier survival curves of WT (blue line) or GM-CSF–KO mice (red line) that received 5.5 Gy of TBI; n = 4, representative of two independent experiments. (G) qRT-PCR analyses for the expression of Csf2 in WT ILC2s from control (Ctrl) or TBI (5.5 Gy) day 2 mice; n = 3, representative of two independent experiments. In the bar charts, the results are shown as mean ± SEM, and each dot represents an individual mouse. Statistical significance was determined by unpaired Student’s t test (A–C and G) or log-rank test (F).

