Figure S5.
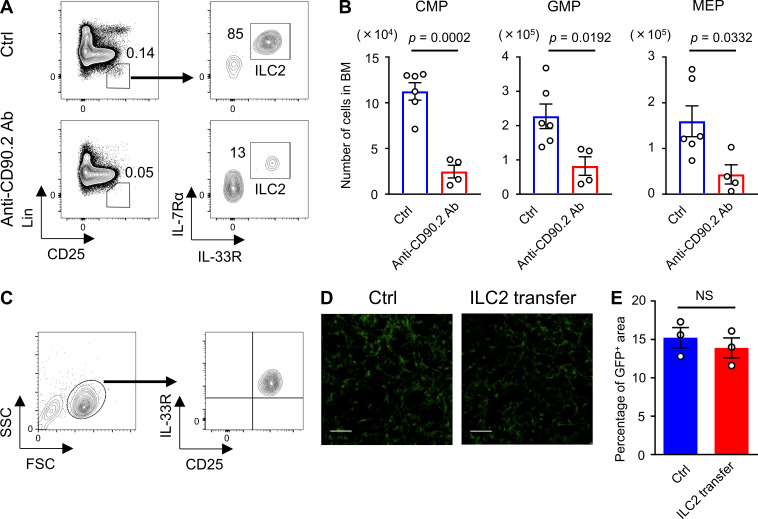
ILC2s are responsible for hematopoietic recovery. (A) Flow cytometry plots of BM cells from control (Ctrl) or anti-CD90.2 Ab-treated WT mice. Mice received four injections of 200 µg anti-CD90.2 Ab intraperitoneally every other day until 1 d before being euthanized. Control mice were injected with PBS. Results shown are representative of three independent experiments. (B) Control and anti-CD90.2 Ab-treated WT mice were injected with 150 mg/kg 5-FU. BM cellularity was analyzed on day 8 after 5-FU treatment. CMP, GMP, and MEP numbers from femurs and tibias; n = 6 in controls, n = 4 in Ab-treated mice. Results shown are representative of two independent experiments. (C) Flow cytometry plots of cultured ILC2s. Results shown are representative of three independent experiments. (D and E) CXCL12-GFP mice were treated with 150 mg/kg 5-FU, and whole-mount confocal microscopy BM analysis was performed on day 7. In the ILC2 transfer group, mice were transferred with 2 × 10⁵ ILC2s from WT mice on days 1 and 2. Control mice were injected with PBS. (D) Representative MIP images of the CXCL12-GFP mice femoral bones. Green, CAR cells. Scale bars, 50 µm. (E) CXCL12-GFP+ area fractions relative to the whole visual field; n = 3, representative of two independent experiments. In the bar charts, the results are shown as mean ± SEM, and each dot represents an individual mouse. Statistical significance was determined by unpaired Student’s t test (B and E).

