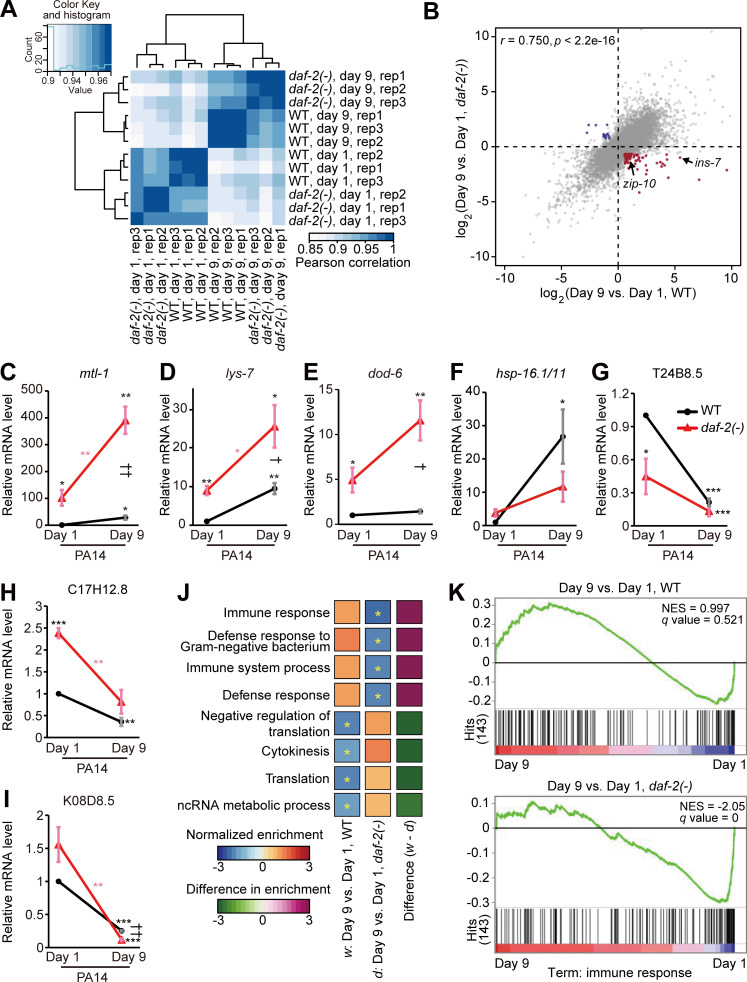
Figure 3.
A subset of age-associated genes are differentially expressed in WT versus daf-2(–) mutant worms. (A) A correlation matrix with hierarchical clustering of day 1 and day 9 adult WT and daf-2(–) animals (n = 3). (B) A scatter plot showing gene expression changes conferred by daf-2 mutation and aging. Genes whose expression was up-regulated and down-regulated with ages in WT but respectively down-regulated and up-regulated with ages in daf-2(–) animals (fold change >1.5, BH-adjusted P value < 0.1) are shown in red and blue, respectively. ins-7 and zip-10 are indicated by arrows. Raw data and processed data are available in the Gene Expression Omnibus (accession no. GSE137861). (C–F) qRT-PCR analysis data showing the mRNA levels of mtl-1 (C), lys-7 (D), dod-6 (E), and hsp-16.1/11 (F) in day 1 and day 9 daf-2(–) and WT adults on PA14 (n = 3); these four genes were selected as representative common targets of DAF-16 and HSF-1 (Barsyte et al., 2001; Hsu et al., 2003; Murphy et al., 2003; Hesp et al., 2015; Sural et al., 2019), but not necessarily as immune-regulating factors. All of these four genes were up-regulated with age in daf-2(–) animals, but the degree of age-dependent increase in the mRNA level of hsp-16.1/11 was not larger in daf-2(–) mutants than in WT worms. Additional data regarding changes in the mRNA levels of the selected genes on OP50 and sod-3 on OP50 and PA14 are shown in Fig. S3, D–I. (G–I) The mRNA levels of three selected PMK-1-regulated genes, T24B8.5 (G), C17H12.8 (H), and K08D8.5 (I), were down-regulated with age in both WT and daf-2(–) animals on PA14 (n = 3). See Fig. S3, J–L for qRT-PCR using worms cultured on OP50. Error bars represent SEM (two-tailed Student’s t test: * and †, P < 0.05; ** and ††, P < 0.01; ***, P < 0.001; black asterisks indicate P values for day 1 WT versus other conditions, pink asterisks indicate P values for day 1 daf-2(–) mutants versus day 9 daf-2(–) mutants, and daggers indicate P values for day 9 WT versus day 9 daf-2(–) mutants). ama-1 was used as a normalization control. (J) Results of GSEA showing terms significantly changed during aging in WT and daf-2(–) animals. Asterisks indicate terms significantly changed (BH-adjusted P value < 0.1). w, differentially expressed genes (with age) in WT; d, differentially expressed genes (with age) in daf-2(–) animals. (K) Enrichment plots of GSEA show 143 “immune response” genes that were significantly down-regulated during aging in daf-2(–), but not in WT, animals. NES, normalized enriched score. q values were obtained by calculating the false discovery rate corresponding to each NES.

