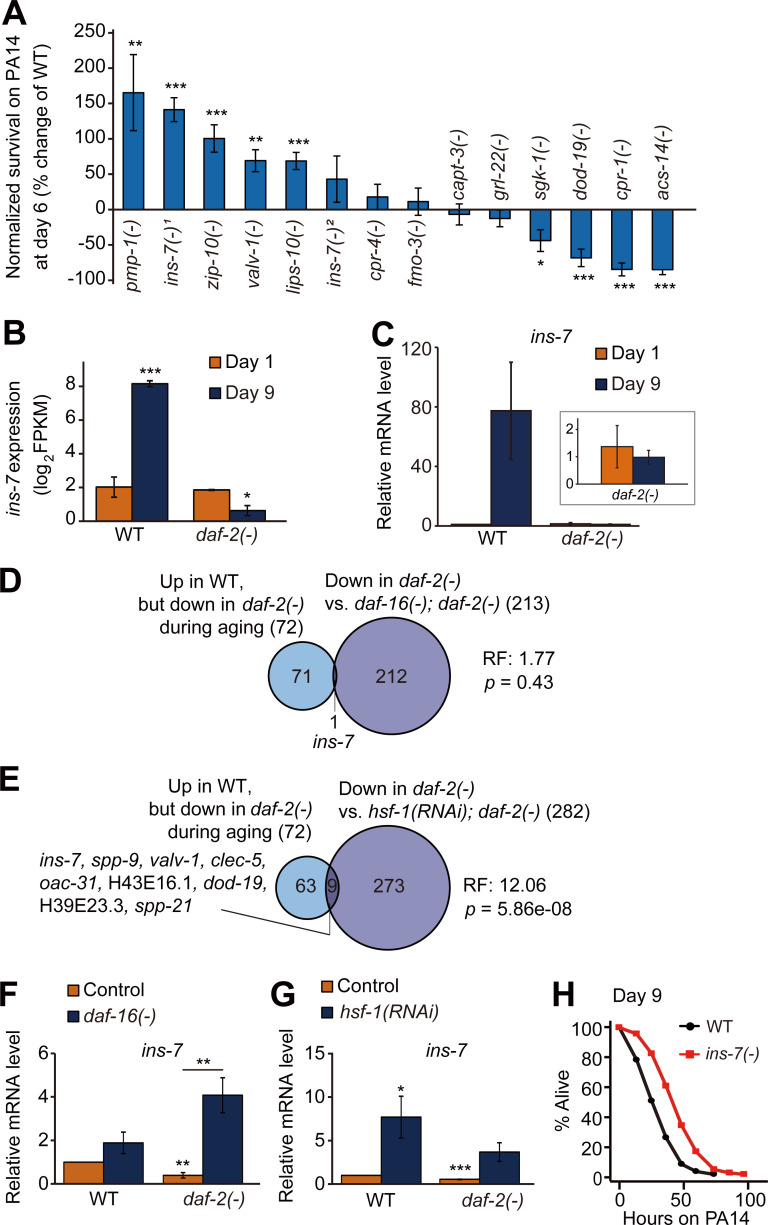
Figure 4.
Down-regulation of ins-7 contributes to enhanced immunocompetence in aged daf-2(–) mutants. (A) Percent change in survival of animals that contain mutations in indicated genes after PA14 infection for 48 h compared with WT (n [set] ≥ 5, error bars represent SEM; *, P < 0.05; **, P < 0.01; ***, P < 0.001). Specific alleles that were used are as follows: pmp-1(ok773) [pmp-1(–)], ins-7(tm1907) [ins-7(–)1], zip-10(ok3462) [zip-10(–)], valv-1(tm6726) [valv-1(–)], lips-10(tm7601) [lips-10(–)], ins-7(tm2001) [ins-7(–)2], cpr-4(ok3413) [cpr-4(–)], fmo-3(ok354) [fmo-3(–)], capt-3(ok1612) [capt-3(–)], grl-22(ok2704) [grl-22(–)], sgk-1(ok538) [sgk-1(–)], dod-19(ok2679) [dod-19(–)], cpr-1(ok1344) [cpr-1(–)], and acs-14(ok3391) [acs-14(–)]. ins-7(–)1 elicited a stronger phenotype than ins-7(–)2 in this screen-type survival assays, but both ins-7(–)1 and ins-7(–)2 mutations increased survival on PA14 at all ages using full survival assays (Fig. 4 H; and Fig. S3, M–Q; see also Fig. S3 legend for discussion). (B and C) mRNA levels of ins-7 in WT and daf-2(–) mutants at days 1 and 9 of adulthood from RNA-seq analysis (FPKM, fragments per kilobase million, n = 3; B) and using qRT-PCR (ama-1 and pmp-3: normalization controls, n = 3; C). Inset indicates the relative mRNA levels of ins-7 in day 1 and day 9 daf-2(–) worms. Error bars represent SEM (two-tailed Student’s t test: ***, P < 0.001; **, P < 0.01; *, P < 0.05). (D and E) Venn diagram represents a significant overlap between genes whose expression levels were oppositely regulated during aging between WT and daf-2(–) animals and genes whose expression was negatively regulated by DAF-16/FOXO (Riedel et al., 2013; D) and HSF-1 (this study; E) in daf-2(–) worms. RF, representation factor. P values were calculated with the hypergeometric probability test. (F and G) qRT-PCR analysis indicates the mRNA levels of ins-7 in daf-16(–) mutants (F) and hsf-1(RNAi) animals (G); the finding in G was first made by Coleen T. Murphy (unpublished data) and was independently reproduced in this paper. Error bars represent SEM (two-tailed Student’s t test: *, P < 0.05; **, P < 0.01). ama-1 was used as a normalization control (n = 4). (H) ins-7(–)1 mutation increased the survival of day 9 adult worms on PA14. See Table S4 for additional repeats and statistical analysis for survival data shown in Fig. 4.

