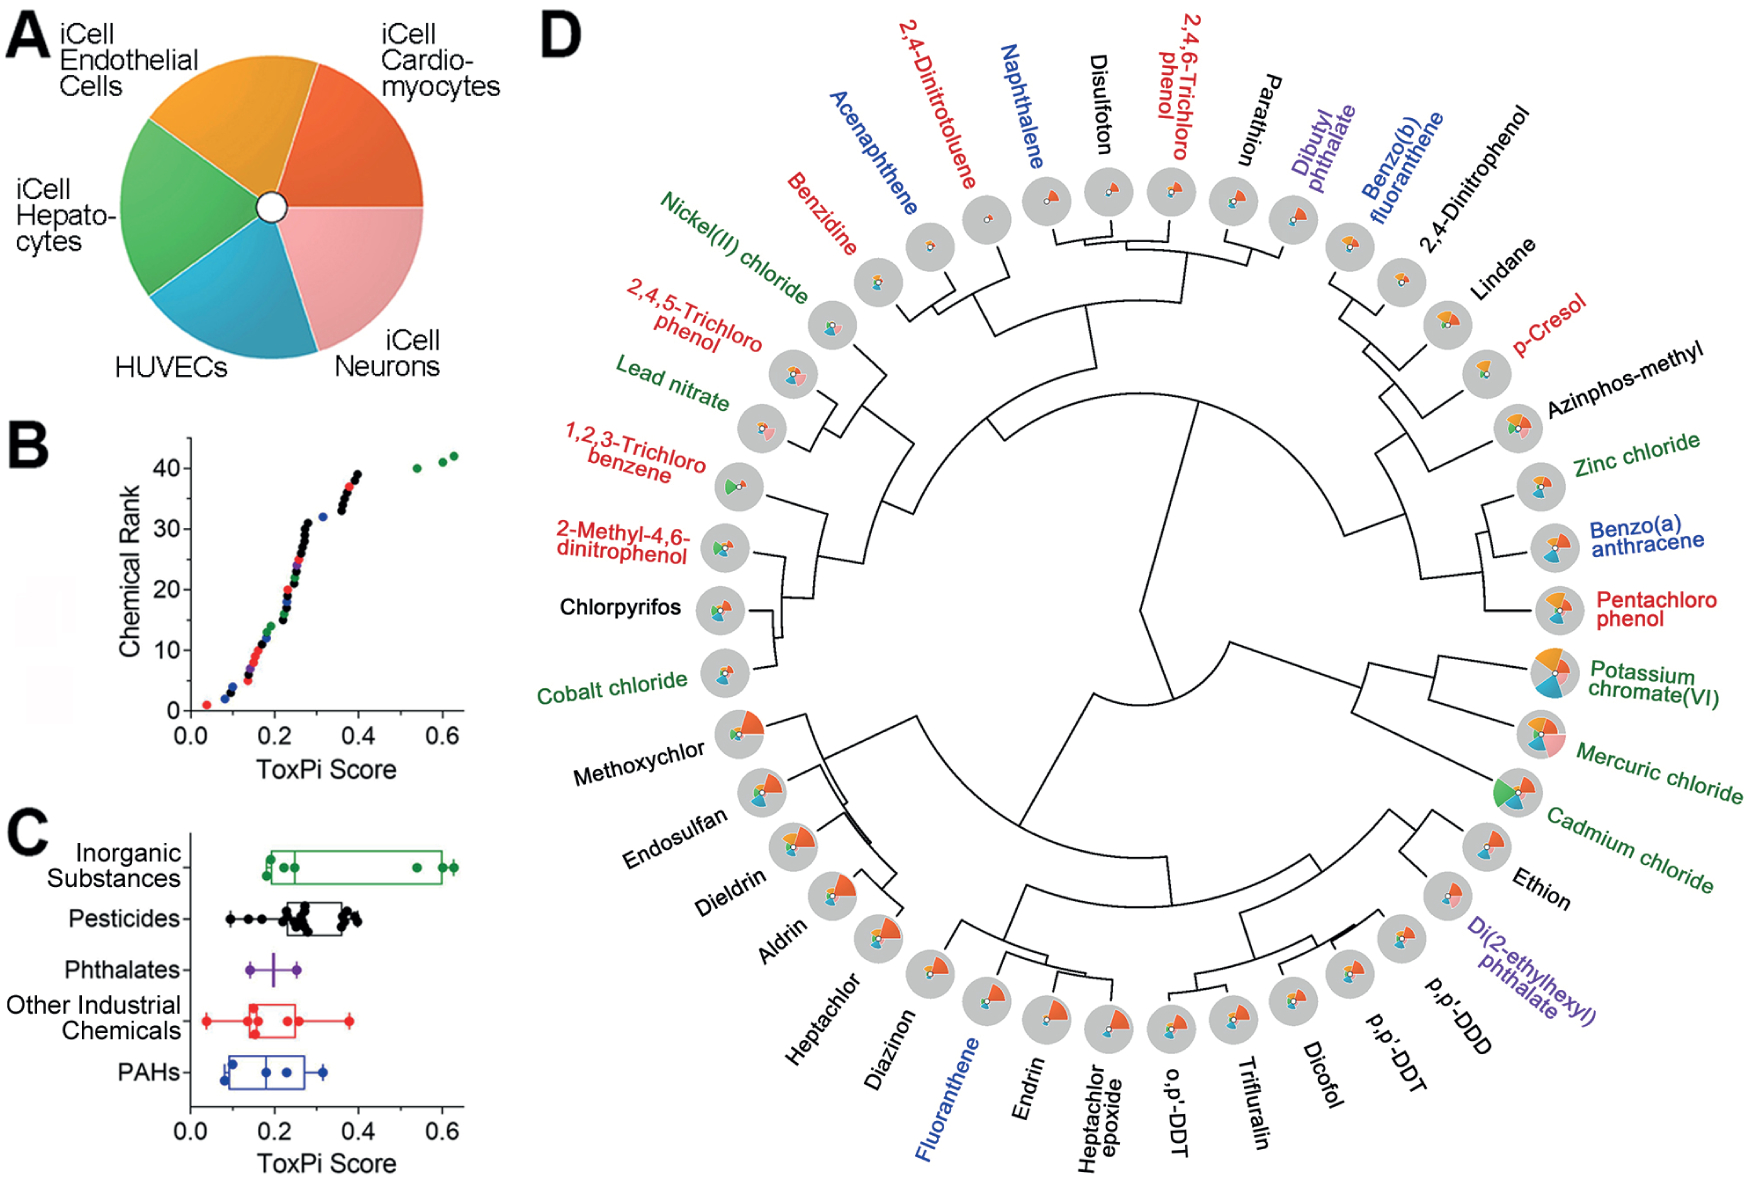
Fig. 4: ToxPi analysis-based ranking and clustering of 42 Superfund priority list chemicals based on the effects in five cell types.

(A) Legend to the ToxPi visualization of the effects on five cell types. (B) Ranking of the tested chemicals based on the overall ToxPi scores. Chemicals are colored based on chemical class. Table S51 contains the data from the ToxPi analysis. (C) Box (inter-quartile range and median) and whiskers (min to max) plots show the range of ToxPi scores for each chemical (dots) for each class. Chemical classes (Tab. 1) were ranked based on the median value. (D) Clustering (Ward’s D method) of 42 Superfund priority list chemicals using ToxPi scores. Chemical names are colored based on chemical class as in panel C.
