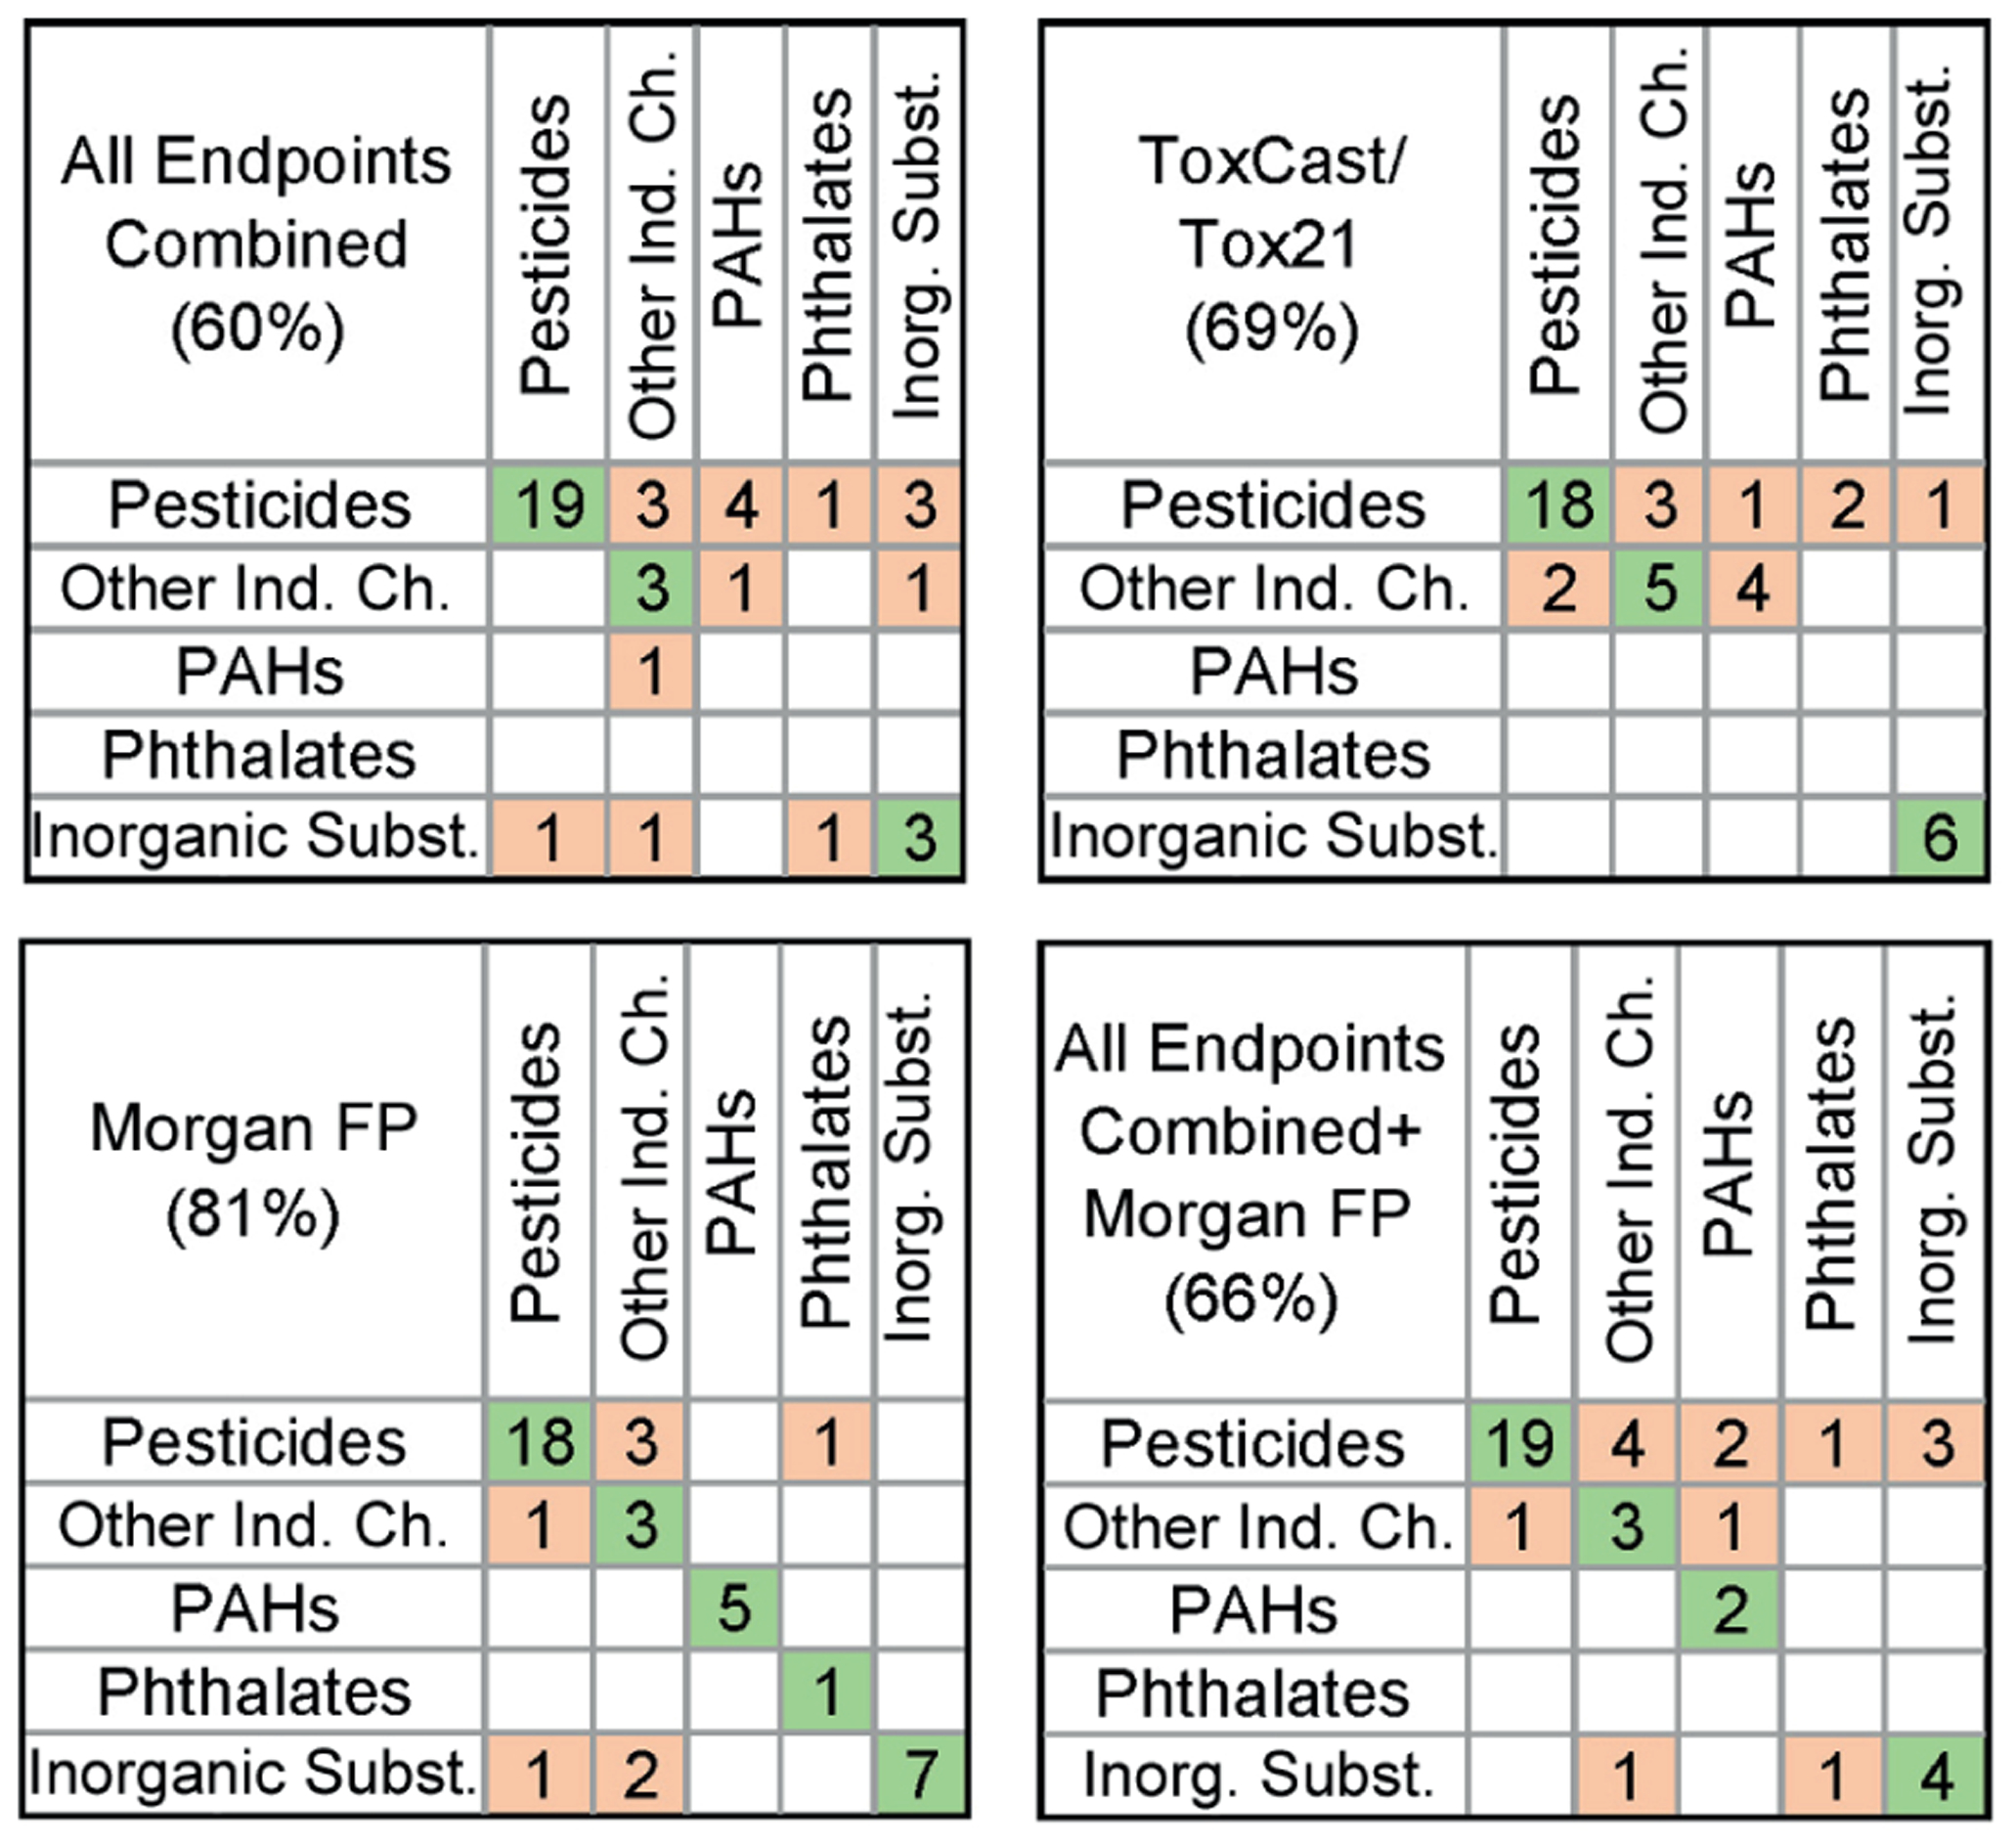
Fig. 6: Confusion matrices for chemical classification into five classes using in vitro and/or chemical descriptors.

Known (columns) chemical assignment into each of five classes (Tab. 1) is compared to predicted (rows) class assignment using random forest algorithm with 5-fold cross validation as detailed in Section 2. Classification outcomes for the analyses using data from all phenotypes in this study (top left), ToxCast/Tox21 data (top right), Morgan fingerprints [FP] (bottom left), or data from this study and Morgan FP combined (bottom right) are shown. Accuracy of classification for each dataset is shown in the top left corner of each matrix. Numbers in the cells filled with green (on diagonal) and light pink (off diagonal) indicate the number of chemicals that were classified correctly or misclassified, respectively.
