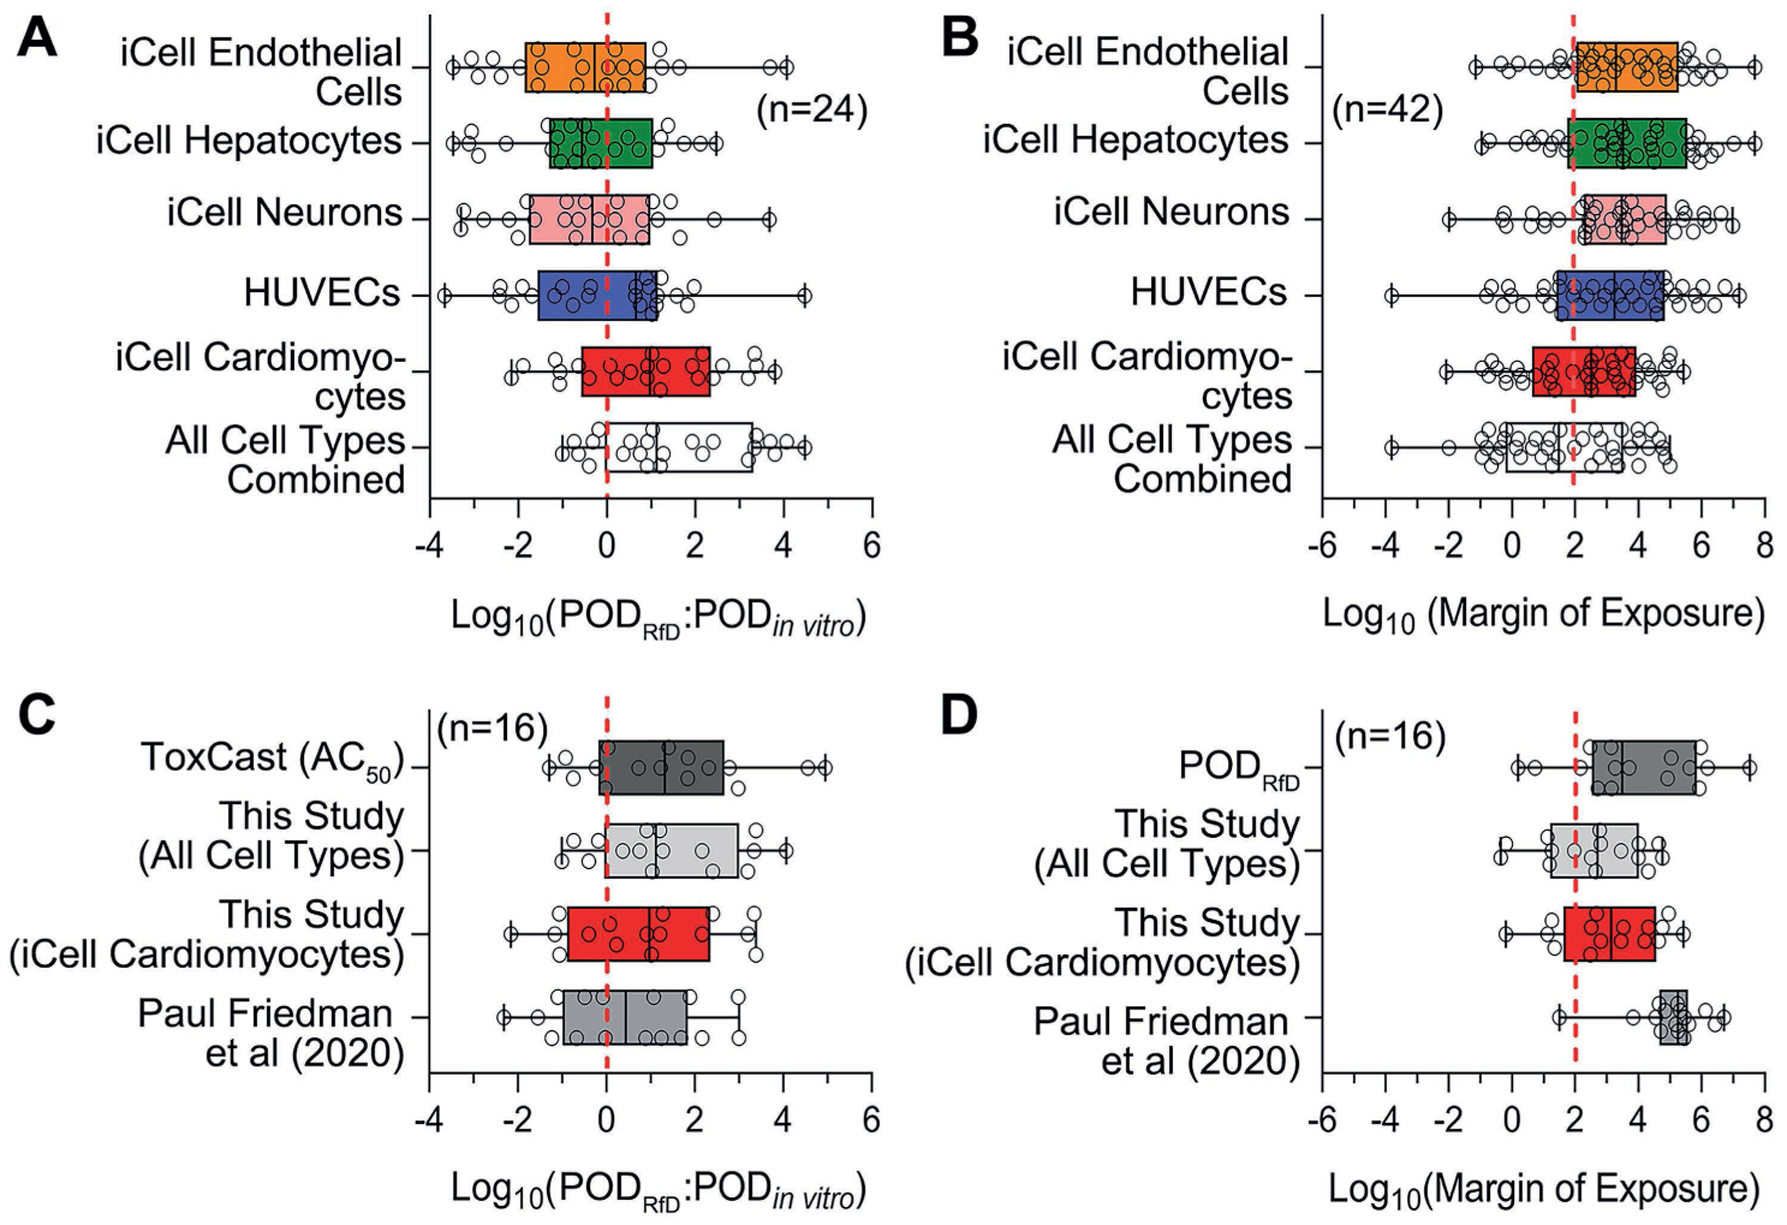
Fig. 8: POD data comparison across different in vitro and in vivo datasets and margin of exposure estimates.

Minimum of in vitro PODs generated from each cell type and all cell types combined in this study were compared to in vivo POD derived from Reference dose (A). Margins of exposure were calculated based on in vitro PODs from this study and the estimated exposure levels (B). The ratio between in vivo and in vitro (C), and the margins of exposure (D) were further compared across different datasets. All of the ratio outputs were log transformed for comparison; n represents the number of chemicals from 42 Superfund priority list chemicals covered by different datasets for comparison and detailed in Table S31.
