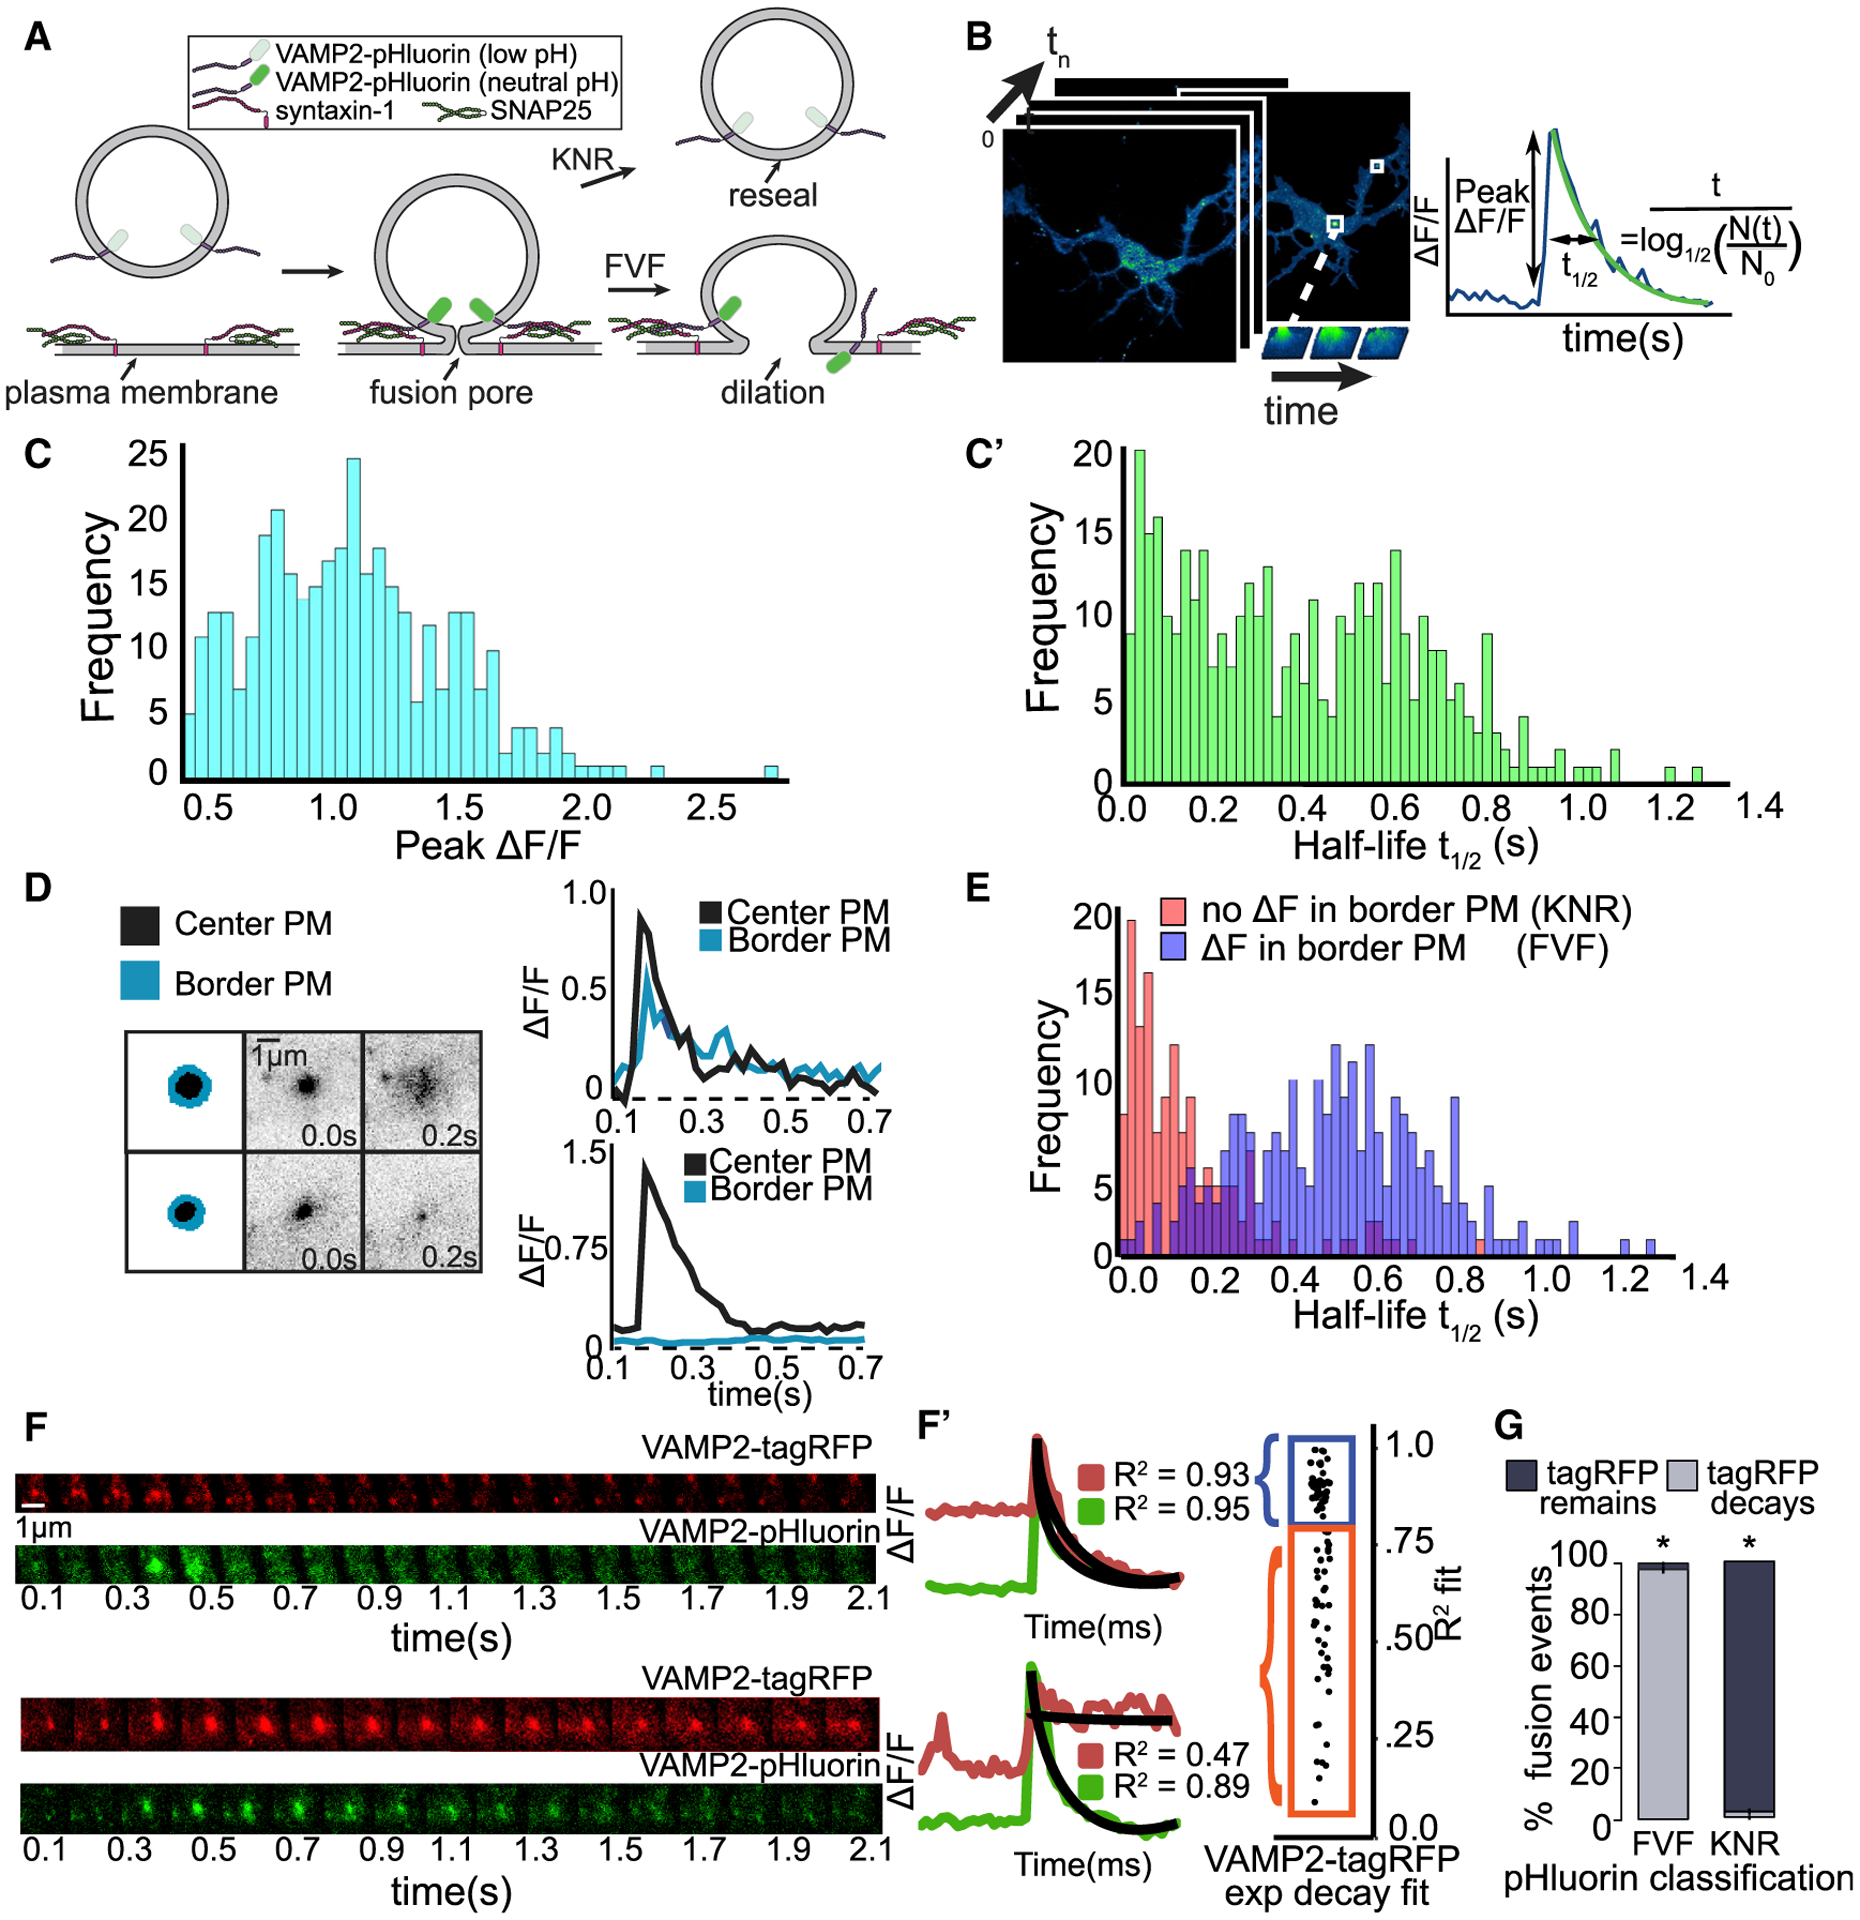
Figure 1. Heterogeneity in single-vesicle exocytic fusion events.

(A) Schematic of exocytic fusion depicts quenching and fluorescence of VAMP2-pHluorin during full-vesicle fusion (FVF) and kiss-and-run fusion (KNR).
(B) Automated detection of exocytic events (green) over time. Features are extracted, including the peak ΔF/F and half-life of fluorescence.
(C) Frequency of peak ΔF/F (C) and fluorescence half-life (t1/2) (C’) of individual events.
(D) Schematic of region of exocytic event (black) and bordering plasma membrane (PM; blue). Plots of ΔF/F over time demonstrate an event with spreading of fluorescence into bordering PM (top, FVF) and an event without spreading of fluorescence (bottom).
(E) Frequency of t1/2 categorized by ΔF in bordering PM. Spreading fluorescence events (ΔF, presumably FVF) have slower fluorescence decay than those without (no ΔF, presumably KNR).
(F) Dual-color imaging of VAMP2-pHluorin and VAMP2-tagRFP (red fluorescence protein) reveals vesicle fusion and vesicle fate, respectively. Example images and ΔF/F curves show that VAMP2-tagRFP either exponentially decays after ΔF/F (top, FVF) or remains in vesicle (bottom, KNR).
(G) Classification of fusion events based on VAMP2-pHluorin behavior and VAMP2-tagRFP behavior agree. Error bars represent standard error of the percent. *p < 0.05, based on a chi-square analysis of expected ratios if classes were assigned randomly.
