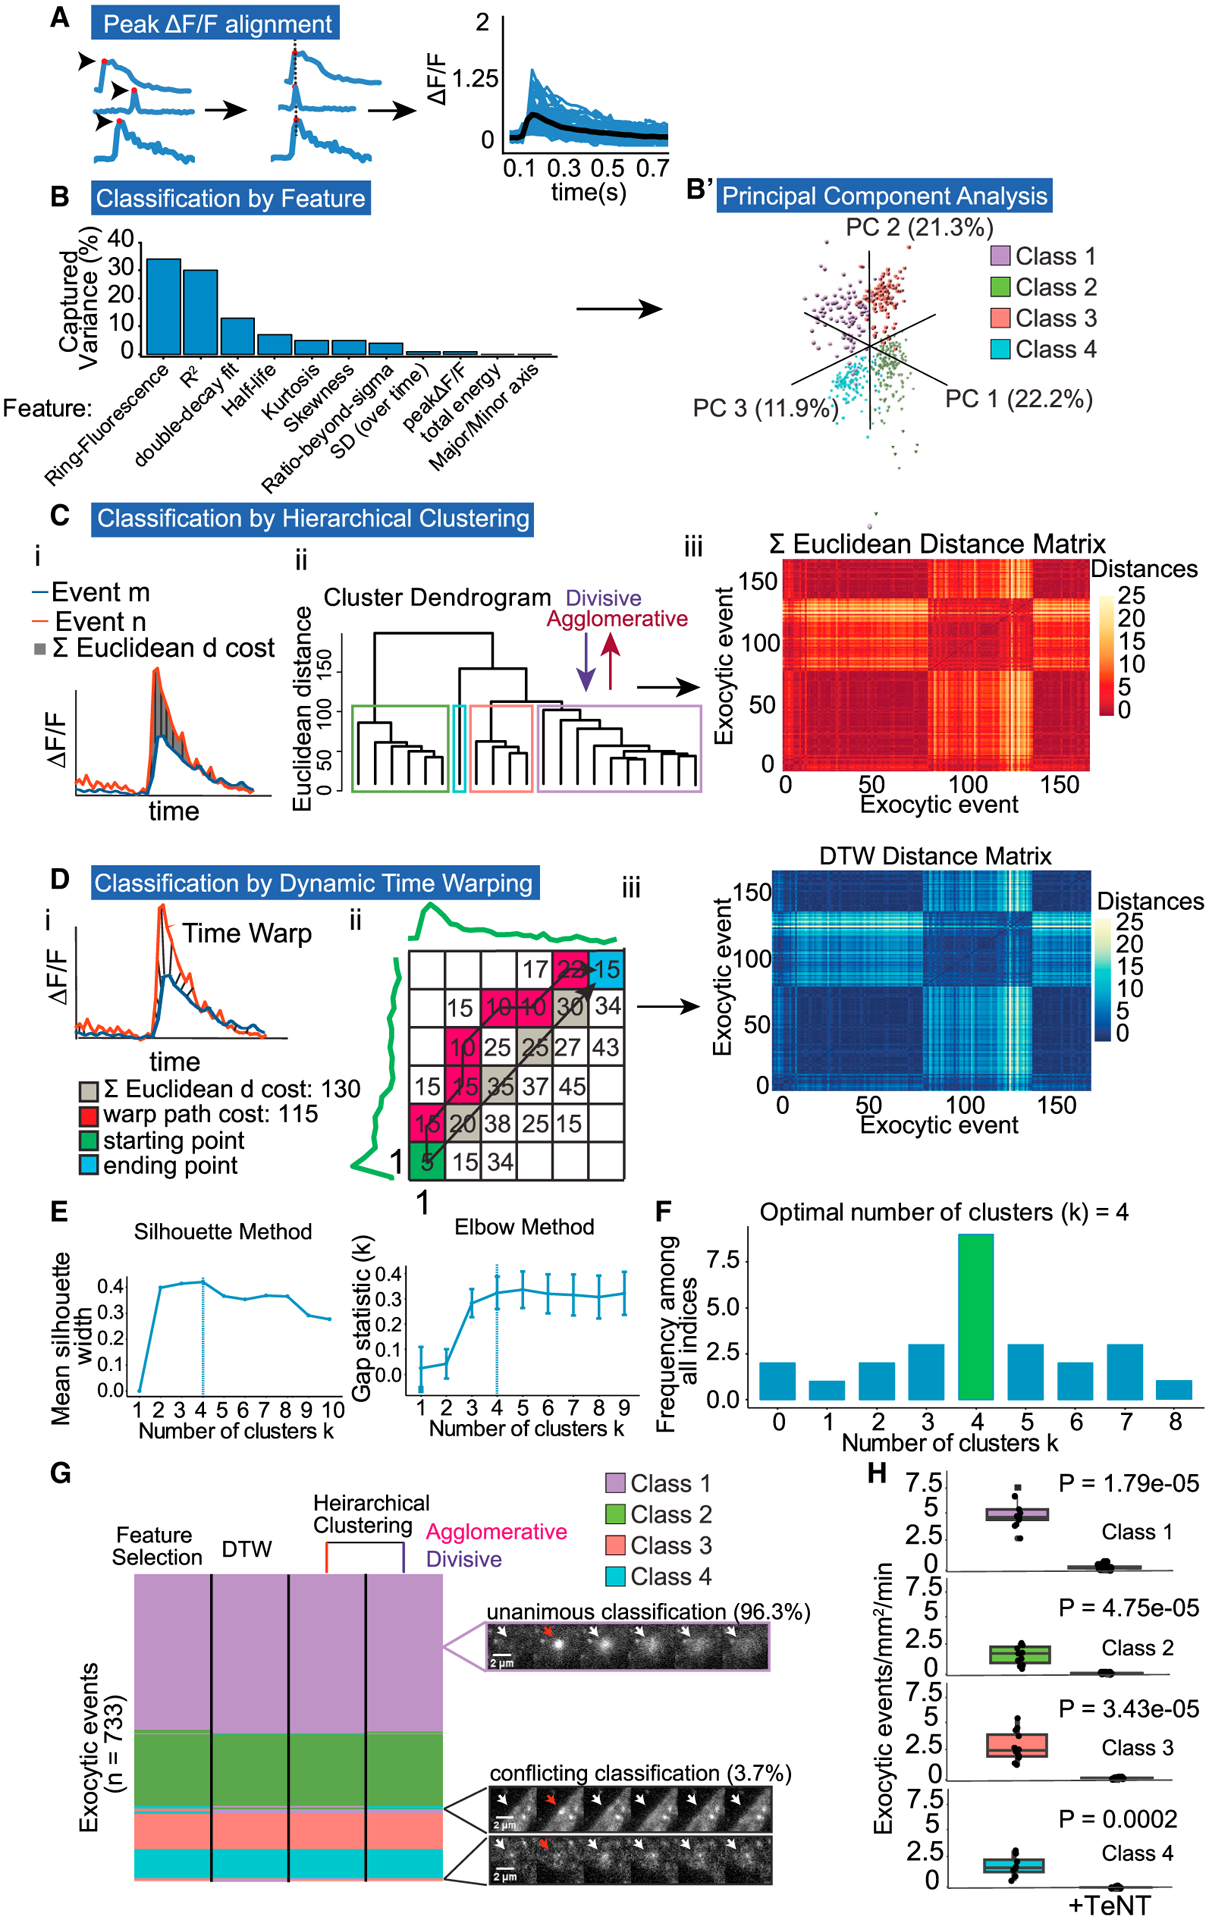
Figure 2. Multiple unbiased classifiers converge on four exocytic modes.

(A) ΔF/F curves are temporally registered to peak ΔF/F (red dot). Registered ΔF/F plot showing average (black) and individual events (blue).
(B) Features that represent % of captured variance from PCA.
(B’) Three principal components plotted reveal four exocytic classes.
(C) Event classification by hierarchical clustering. (i) ΔF/F plot depicting the summed (Σ) Euclidean distance between two exocytic events, m and n. (ii) Dendrogram of Σ Euclidean distances between multiple events, linked by agglomerative or divisive hierarchical clustering reveal four classes. (iii) Each pixel in distance matrix is the Σ Euclidean distance between two ΔF/F curves (n = 733).
(D) Event classification by dynamic time warping (DTW). (i) ΔF/F plot depicting time warped distance between two events, m and n. (ii) A matrix of Euclidean distances measured at all time points comparing a pair of events, starting at peak ΔF/F (green square, coordinates 1,1). Unlike the Σ Euclidean distance (gray), DTW uses the warp path with the lowest cost (red squares) to reach the ending point (blue square). The sum of the total warp path is the DTW cost per pair of events. (iii) Each pixel in distance matrix is the DTW cost between two ΔF/F curves (n = 733).
(E) Two example indices, silhouette and elbow methods, used in the plurality rules committee suggest four exocytic classes. Error bars report standard error.
(F) Decision histogram of the committee of indices, with the plurality of indices choosing four exocytic classes (8/20).
(G) Classification comparison of each clustering method. A total of 96.3% of 733 events were classified unanimously. Purple inset: representative unanimously classified exocytic event. Black inset: representative events with conflicting classification. Cell edge effects (top black inset) or low signal-to-noise ratio (bottom black inset) account for the majority of conflict. White arrows denote exocytic events. Red arrows denote peak ΔF/F.
(H) Frequency of all event classes drops to near zero with tetanus toxin (TeNT) treatment (Welch’s t test, n = 12 cells per experiment).
