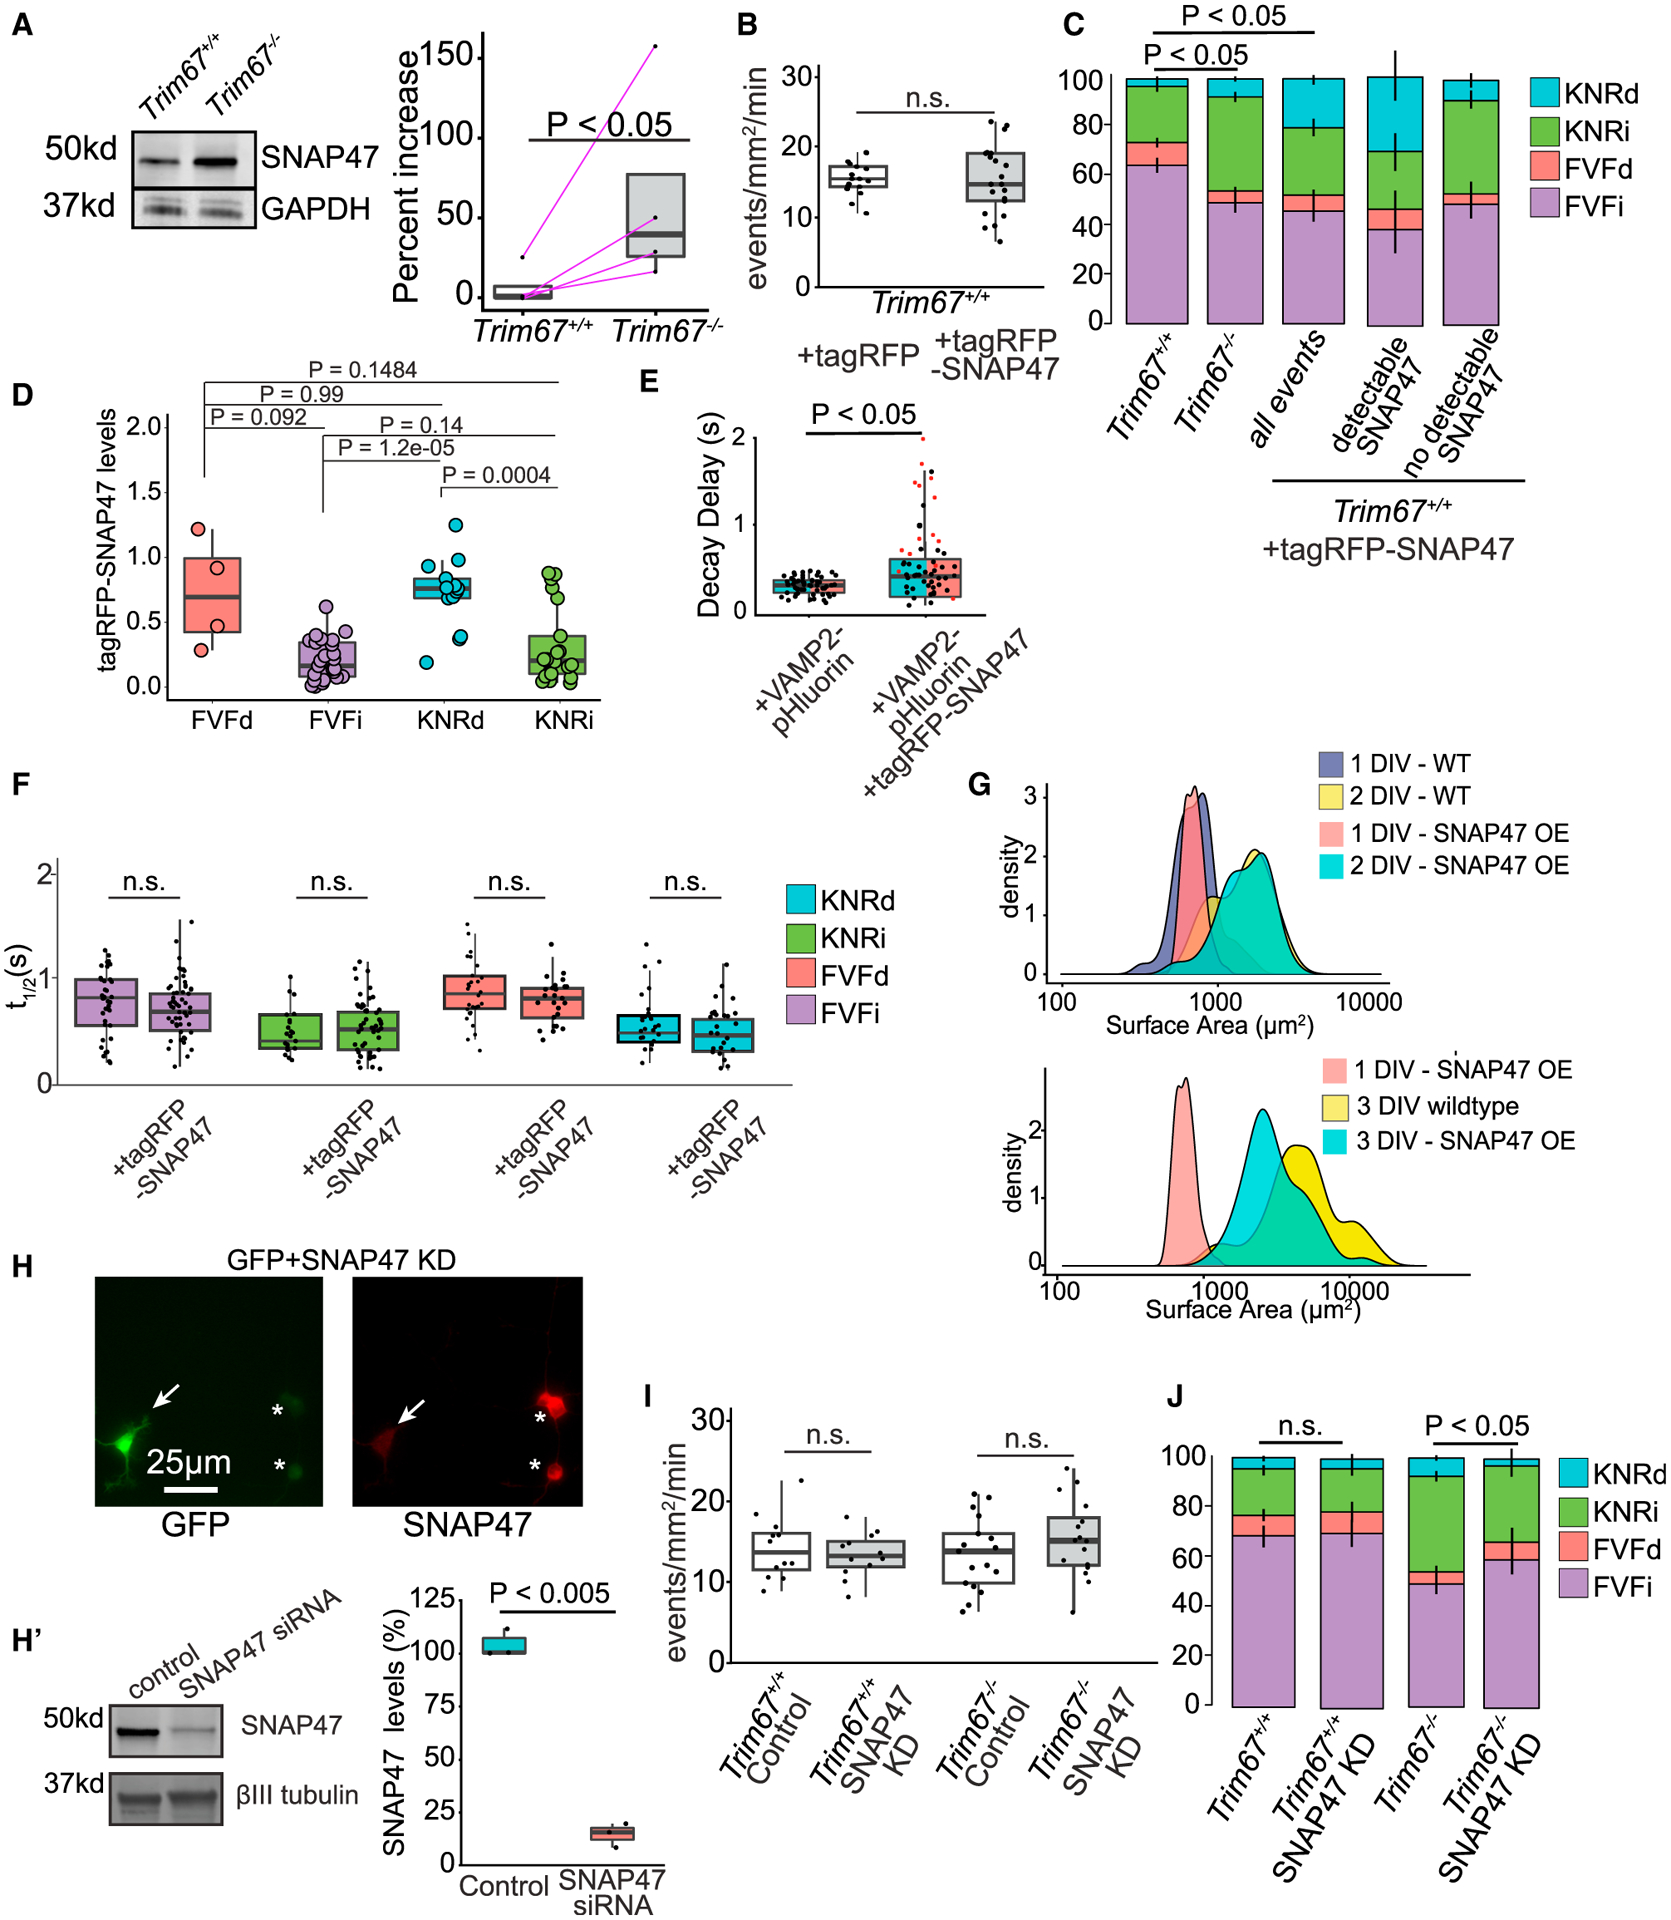
Figure 6. TRIM67 alters exocytosis by modulating SNAP47 protein levels.

(A) Immunoblot of SNAP47 and GAPDH from lysate of Trim67+/+ and Trim67−/− cortical neurons at 2 DIV. Quantification of percent increase of SNAP47/GAPDH from 4 blots (right; log-paired t test, analysis in STAR methods).
(B) Frequency of VAMP2-pHluorin exocytosis ± tagRFP or tagRFP-SNAP47 (n = 16 neurons per condition, n = 3 biological experiments, Welch’s t test).
(C) Relative proportions of exocytic modes in Trim67+/+ neurons, Trim67−/− neurons, or Trim67+/+ neurons expressing tagRFP-SNAP47 (n = 16 neurons per condition; n = 3 biological replicates; multivariate linear regression, error bars report standard error of the percent).
(D) tagRFP-SNAP47-normalized fluorescence intensity at fusion sites (n = 16 neurons, n = 3 biological replicates; Welch’s t test with Benjamini-Hochberg correction).
(E) Quantification of time after peak ΔF/F before fluorescence decay onset of KNRd and FVFd events (n = 17 neurons; n = 4 biological replicates; Welch’s t test).
(F) t1/2 of each exocytic class ± TagRFP-SNAP47 (n = 17 neurons per condition; Welch’s t test with Benjamini-Hochberg correction).
(G) Measured neuronal surface areas at indicated times and conditions.
(H) Example SNAP47 immunocytochemistry images in neurons expressing siRNA for SNAP47 knockdown (KD) (GFP+, arrow) or without (*). Cells were transfected with an eGFP expression plasmid and SNAP47 siRNA, followed by immunostaining of SNAP47; GFP-positive neurons did not stain for SNAP47, suggesting KD of SNAP47. (H’) Immunoblot and quantification of SNAP47 and βIII tubulin protein levels in SNAP47 KD compared with control (n = 3 experiments; Welch’s t test).
(I) Frequency of VAMP2-pHluorin exocytosis ± SNAP47 siRNA (n = 12 neurons per condition; Welch’s t test).
(J) Relative proportions of exocytic classes in Trim67+/+ neurons and Trim67−/− neurons, with SNAP47 KD (n = 12 neurons per condition, n = 3 biological replicates; multivariate linear regression, error bars report standard error of the percent).
