Figure 6.

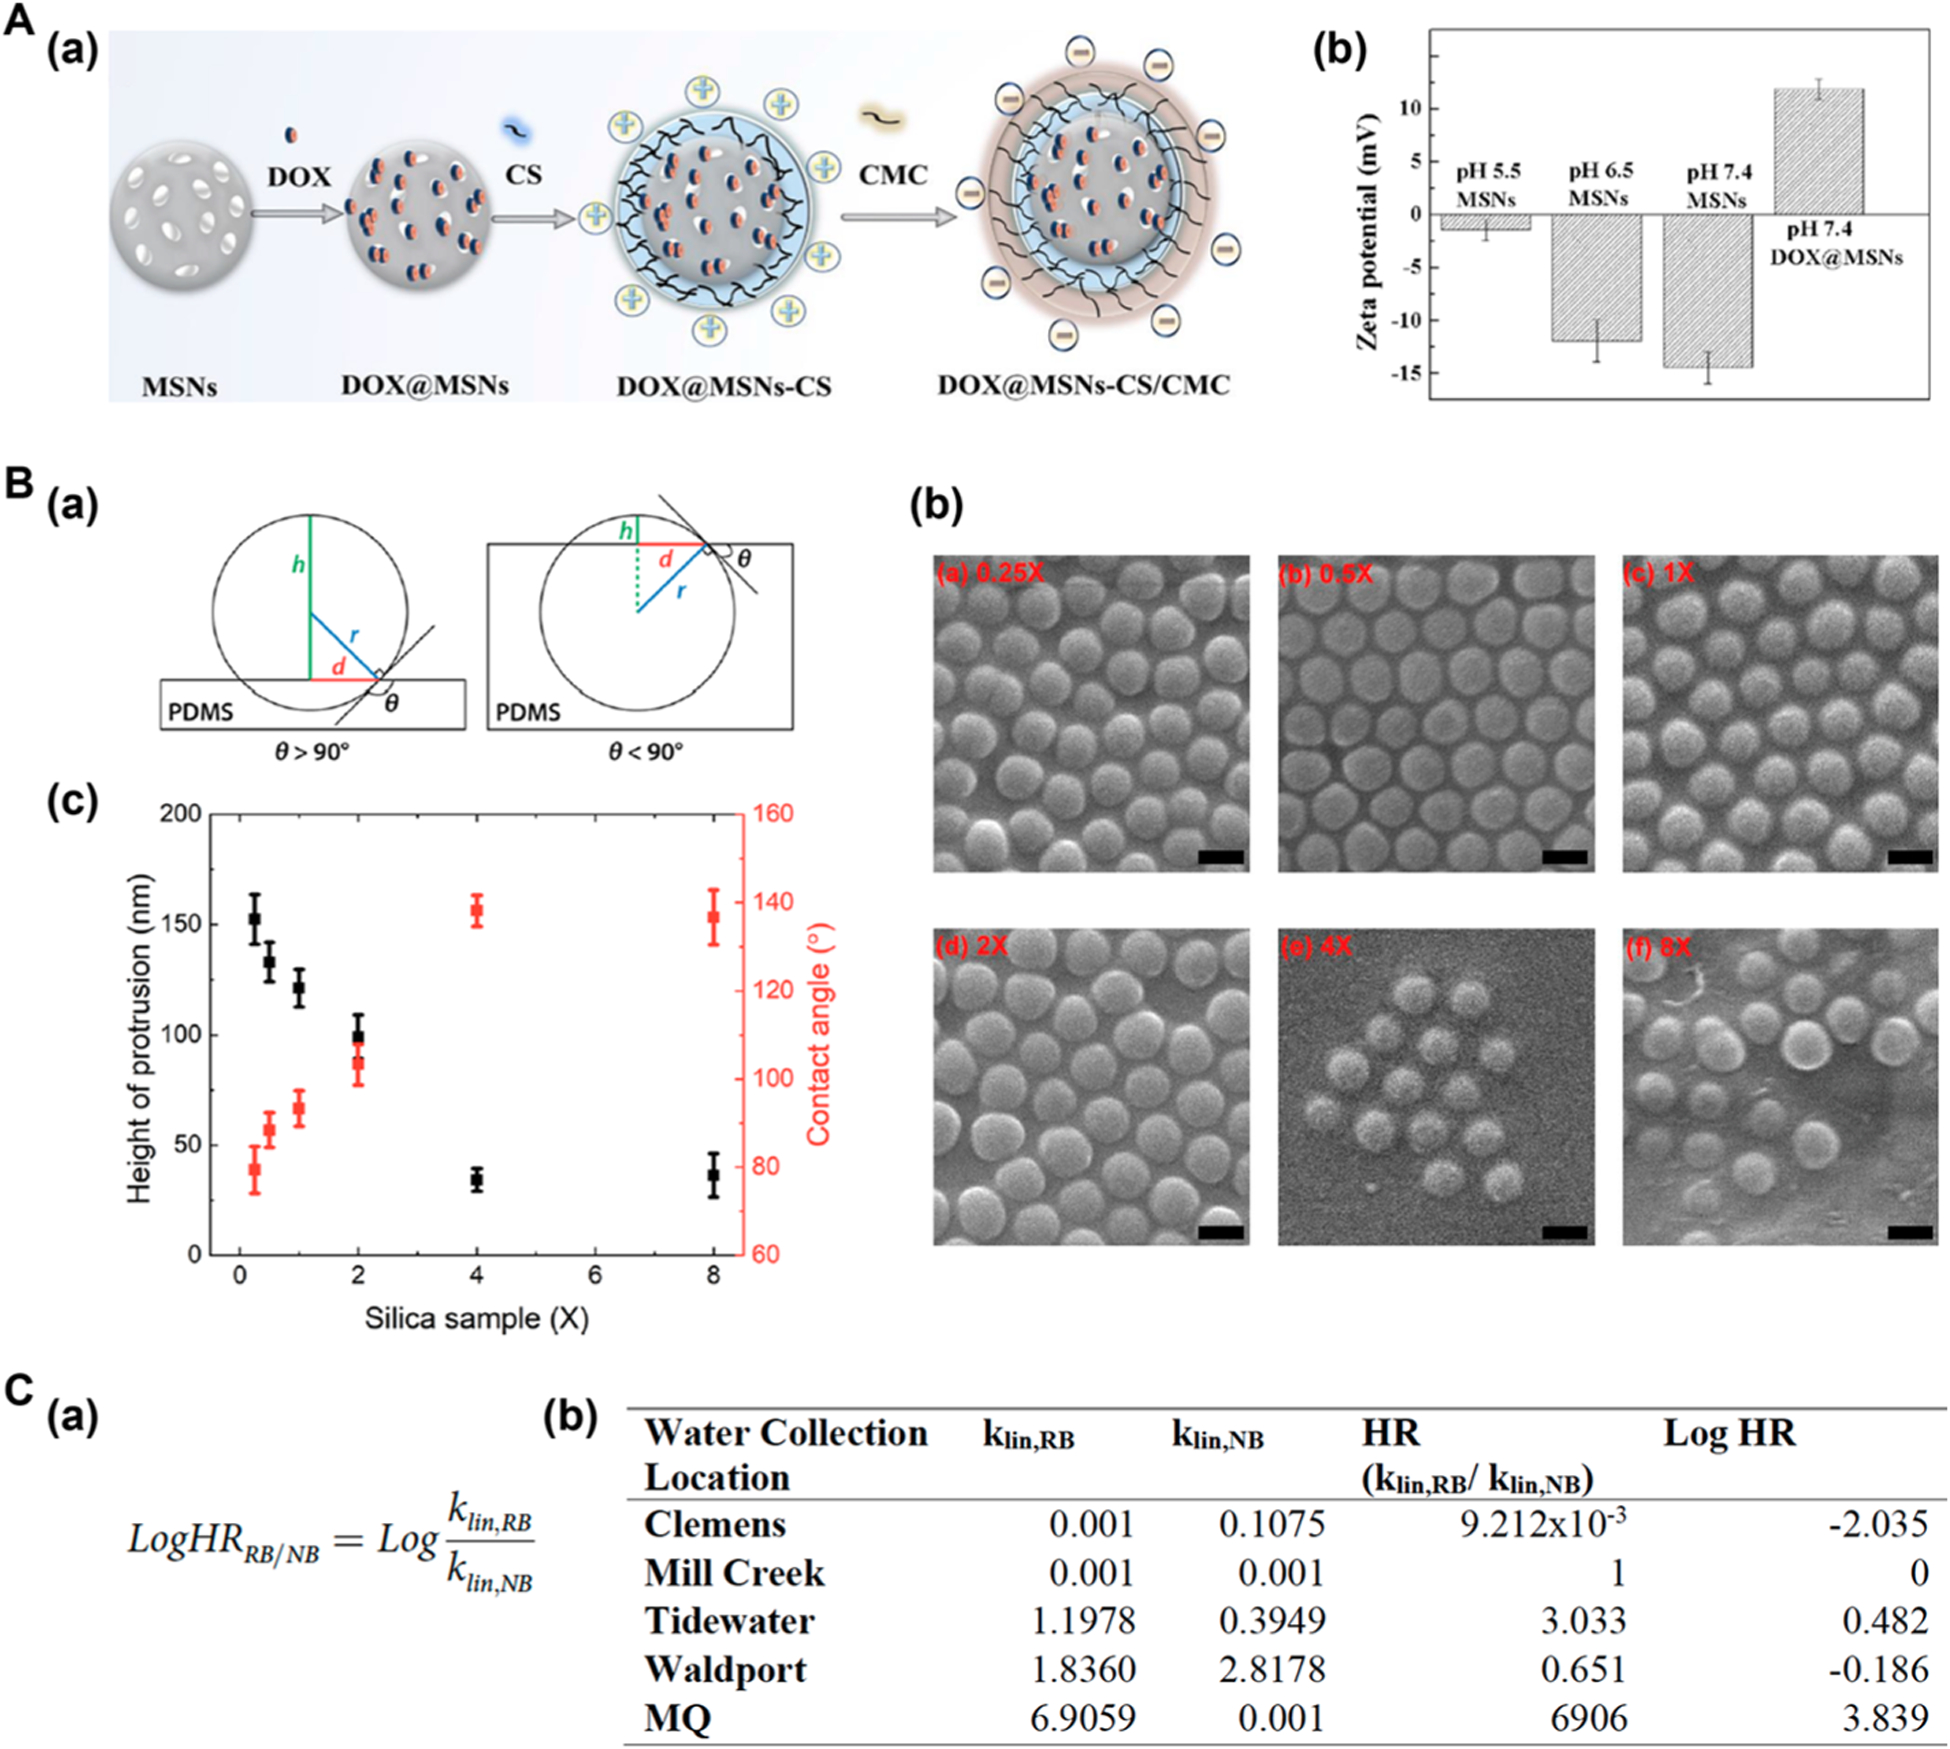
(A) Zeta potential to characterize surface charge of nanocarriers. (a) Synthesis of the nanocarrier. (b) Zeta potential to monitor the surface charge during the construction of nanocarrier at different pHs. Reproduced from Cui, L.; Liu, W.; Liu, H.; Qin, Q.; Wu, S.; He, S.; Pang, X.; Zhu, C.; Shen, P. ACS Appl. Bio Mater. 2019, 2, 1907–1919 (ref 93). Copyright 2014 American Chemical Society. (B) Three-phase contact angle measurement of functionalized silica nanoparticles at the water–n-decane interface. (a) Schematic showing the position of nanoparticles in PDMS for θ > 90° and θ < 90°. (b) SEM images of nanoparticles embedded in PDMS. 1× was the amount of ODTMS needed to attach one molecule per nm2 of the particle surface. Scale bars: 200 nm. (c) Measured protrusion heights h and contact angles θ. Reproduced from Zhang, X.; Gong, J.; Yang, X.; Slupe, B.; Jin, J.; Wu, N.; Sum, A. K. ACS Omega 2019, 4, 13496–13508 (ref 96). Copyright 2019 American Chemical Society. (C) Dye adsorption method to measure hydrophobicity of nanoparticles. (a) Calculation of hydrophobicity ratio (HR). (b) Log HR values of TiO2 nanoparticles in different environments. Reproduced from Crandon, L. E.; Boenisch, K. M.; Harper, B. J.; Harper S. L. PLOS One 2020, 15, e0233844 (ref 98). Copyright 2020 PLOS.
