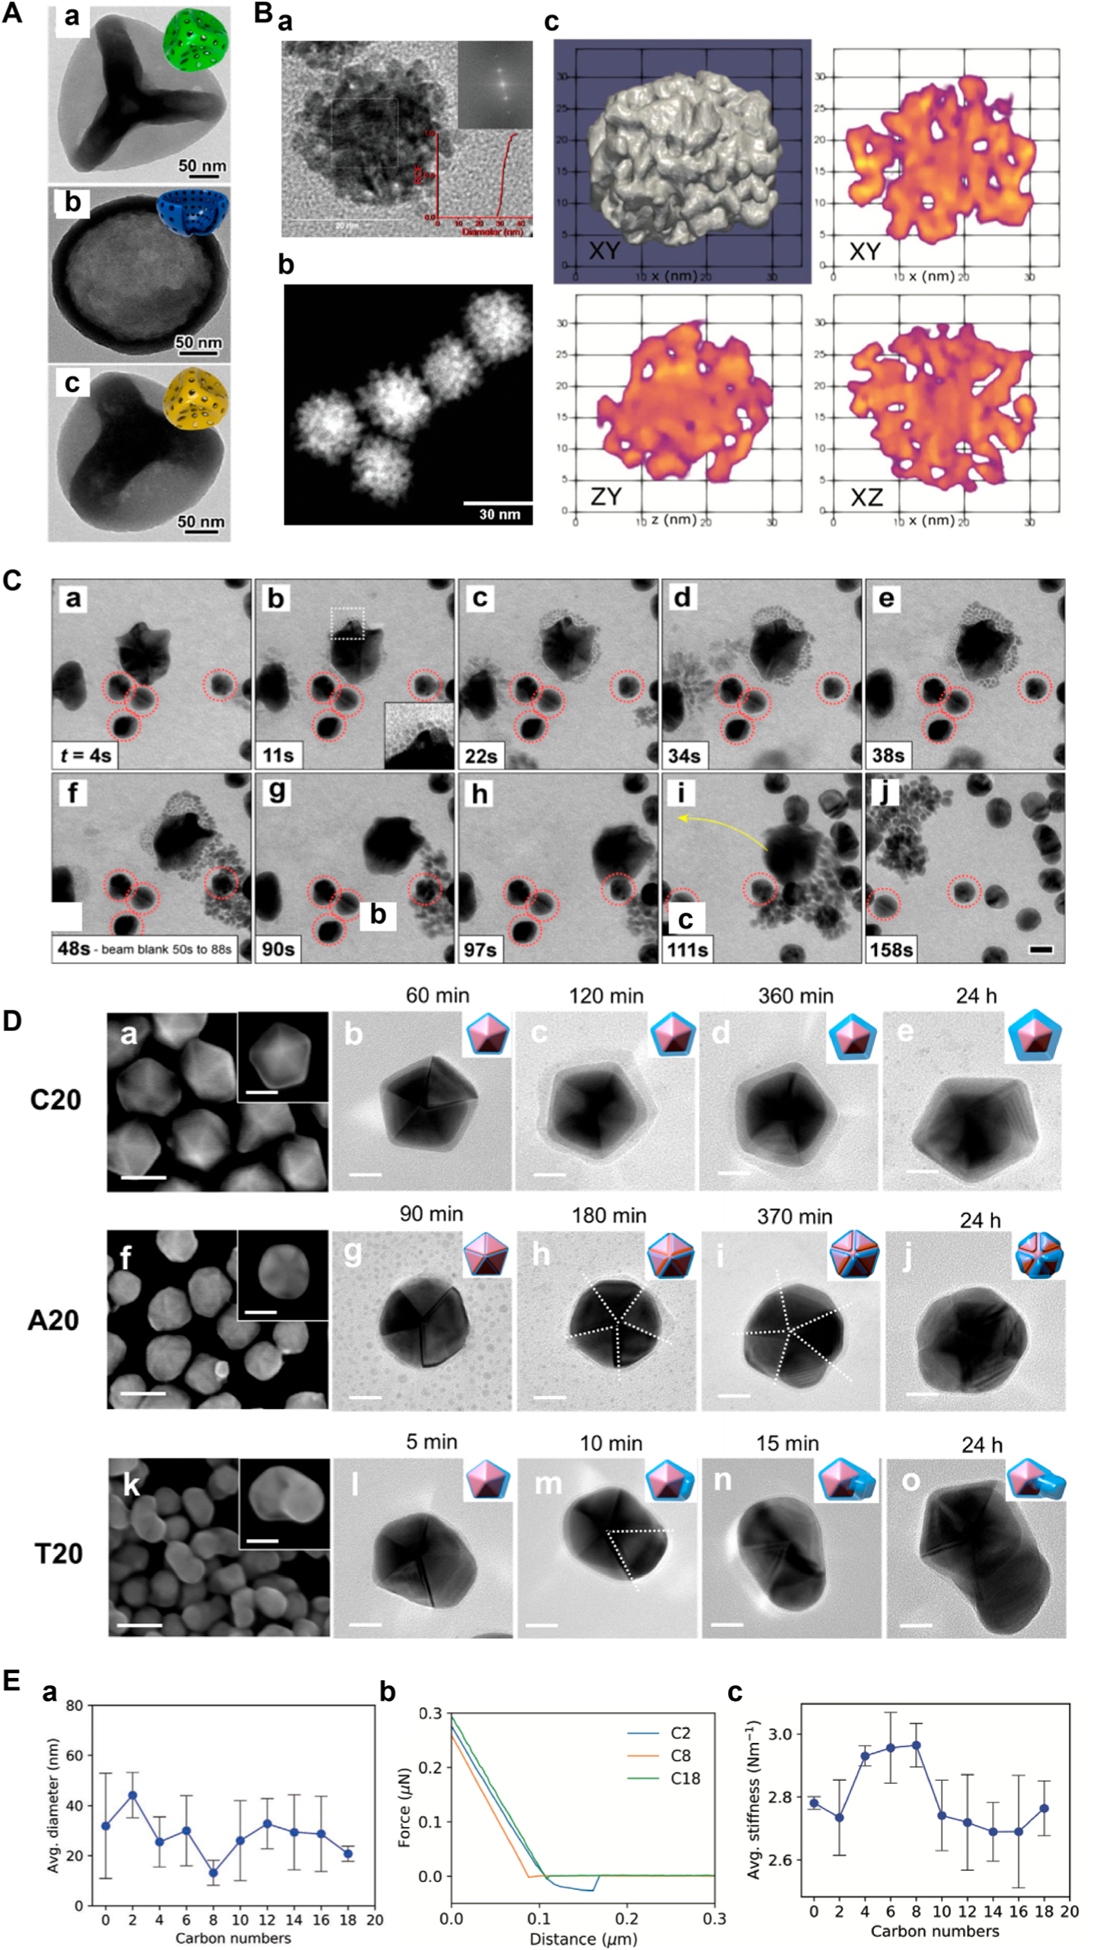
Figure 9.

(A) TEM images of (a) thioether- (b) benzene-, and (c) ethane-bridged mesostructured organosilica nanospheres. Reproduced from Teng, Z.; Wang, C.; Tang, Y.; Li, W.; Bao, L.; Zhang, X.; Su, X.; Zhang, F.; Zhang, J.; Wang, S.; Zhao, D.; Lu, G. J. AM. Chem. Soc. 2018, 140, 1385–1393 (ref 125). Copyright 2018 American Chemical Society. (B) Tomographic reconstruction of a PtNP. (a) HRTEM image of the porous PtNP. The inset showed the Fourier transforms of the image taken from the area highlighted by the dotted white box. The red curve plotted the relative cumulative frequency (RCF) distribution of the particle diameter. (b) HAADF-STEM image of porous PtNPs. (c) Rendered view of 3D reconstruction down the z axis, and perpendicular cross-sectional views of PtNP through the nanoparticle in the XY, ZY, and XZ planes obtained from HAADF-STEM. Reproduced from Yu, W.; Batchelor-McAuley, C.; Wang, Y.-C.; Shao, S.; Fairclough, S. M.; Haigh, S. J.; Young, N. P.; Compton, R. G. Nanoscale 2019, 11, 17791–17799 (ref 126), with permission of The Royal Society of Chemistry. (C) LC–TEM to monitor nanoparticle growth. (a–j) Images captured at each time point showing the growth of AuNPs, which can be seen moving around in the LC. Inset in (b) showed small nanoparticles nucleating around a newly formed large nanoparticle. Circled in red are citrate-capped AuNPs that were immobilized on the LC. Reproduced from Robertson, A. W.; Zhu, G.; Mehdi, B. L.; Jacobs, R. M. J.; De Yoreo, J.; Browning, N. D. ACS Appl. Mater. Interfaces 2018, 10, 22801–22808 (ref 129). Copyright 2018 American Chemical Society. (D) SEM and TEM time point images of Au–Ag core–shell nanoparticles formed in the presence of (a–e) C20, (f–j) A20, and (k–o) T20. The white dashed lines in the TEM images highlight the twin boundary along which the Ag shells selectively grew. Scale bars are 50 and 20 nm in SEM and TEM images, respectively. Reproduced from Wang, Y.; Counihan, M. J.; Lin, J. W.; Rodŕiguez-López, J.; Yang, H.; Lu, Y.J. Am. Chem. Soc. 2020, 142, 20368–20379 (ref 130). Copyright 2020 American Chemical Society. (E) (a) Average diameters of carboxy-protected EGaIn nanoparticles measured by AFM. (b) F–D curves for C2-, C8-, and C18-protected EGaIn nanoparticles. (c) Average stiffness versus chain length of carboxy-protected EGaIn nanoparticles. Reproduced from Hafiz, S. S.; Labadini, D.; Riddell, R.; Wolff, E. P.; Xavierselvan, M.; Huttunen, P. K.; Mallidi, S.; Foster, M. Surfaces and Interfaces of Liquid Metal Core–Shell Nanoparticles under the Microscope. Part. Part. Syst. Charact. 2020, 37, 1900469 (ref 132). Copyright 2020 Wiley.
