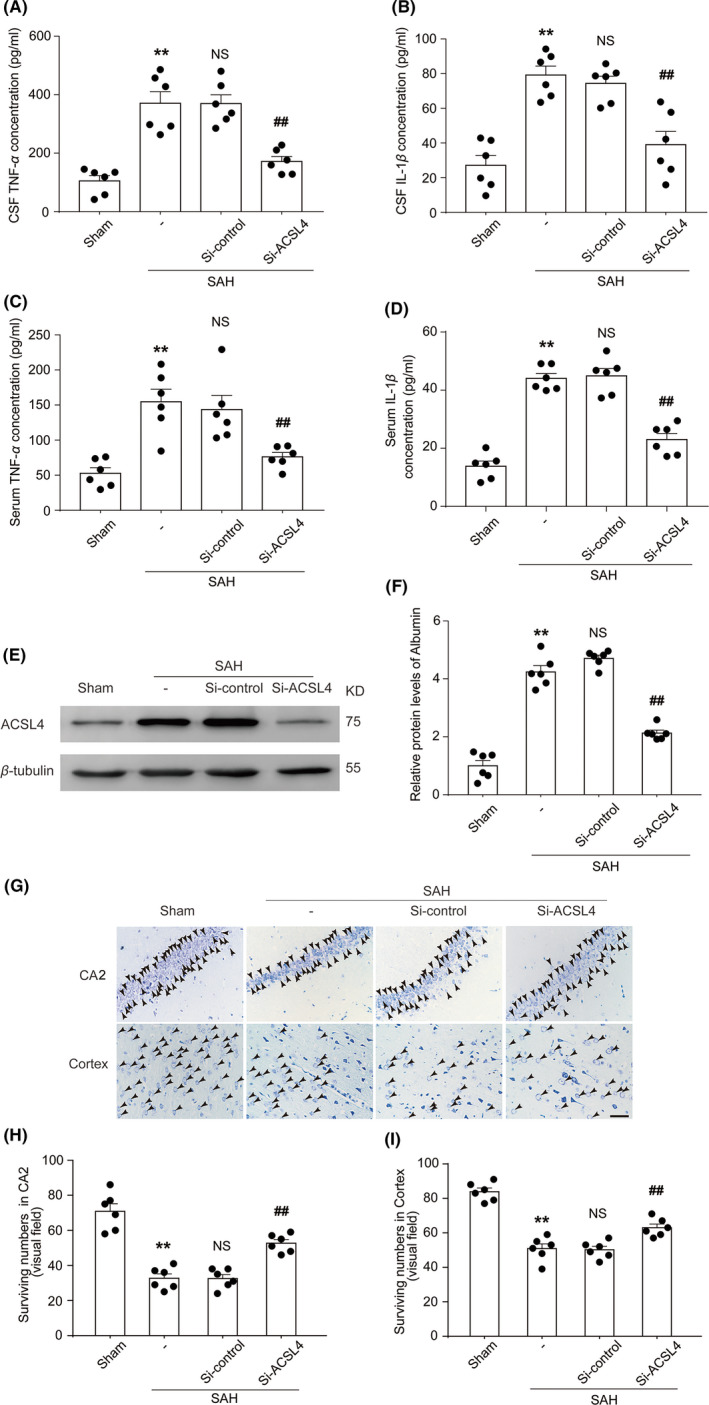
FIGURE 2.

(A) Quantification analysis of TNF‐α concentrations in CSF samples obtained from rats in various groups at 24 h after SAH induction. **p = 0.0001 vs. Sham group; ## p = 0.0002 vs. SAH + Si‐control group; results analyzed using unpaired t‐test, n = 6. NS, no significant difference (p = 0.9845) vs. SAH group; unpaired t‐test, n = 6. (B) Quantification analysis of IL‐1β concentration in CSF samples obtained from rats in various groups at 24 h after SAH induction. **p < 0.0001 vs. Sham group; ## p = 0.0025 vs. SAH + Si‐control group; unpaired t‐test, n = 6. NS, no significant difference (p = 0.4889) vs. SAH group; results analyzed using unpaired t‐test, n = 6. (C) Quantification analysis of TNF‐α concentration in blood samples obtained from rats in various groups. **p = 0.0004 vs. Sham group; ## p = 0.0094 vs. SAH + Si‐control group; results analyzed using unpaired t‐test, n = 6. NS, no significant difference (p = 0.6968) vs. SAH group; unpaired t‐test, n = 6. (D) Quantification analysis of IL‐1β concentration in blood samples obtained from rats in various groups. **p < 0.0001 vs. Sham group; ## p < 0.0001 vs. SAH + Si‐control group; results analyzed using unpaired t‐test, n = 6. NS, no significant difference (p = 0.7763) vs. SAH group; unpaired t‐test, n = 6. (E) Western blotting shows albumin levels in brain tissue of rats in various groups at 24 h after SAH induction. (F) Quantification analysis of relative albumin levels in various groups. **p < 0.0001 vs. Sham group; ## p < 0.0001 vs. SAH + Si‐control group; results analyzed using unpaired t‐test, n = 6. NS, no significant difference (p = 0.0852) vs. SAH group; unpaired t‐test, n = 6. (G) Nissl staining shows surviving neurons in the CA2 hippocampal region and temporal cortex of rats in various groups at 24 h after SAH induction black arrows indicate surviving neurons. Scale bar = 40µm. Quantification analysis of surviving neurons in the CA2 region of the hippocampus (H), **p < 0.0001 vs. Sham group; ## p < 0.0001 vs. SAH + Si‐control group; results analyzed using unpaired t‐test, n = 6. NS, no significant difference (p = 0.9619) vs. SAH group; unpaired t‐test, n = 6. Quantification analysis of surviving neurons in the temporal cortex (I), **p < 0.0001 vs. Sham group; ## p = 0.0014 vs. SAH + Si‐control group; results analyzed using unpaired t‐test, n = 6. NS, no significant difference (p = 0.8508) vs. SAH group; unpaired t‐test, n = 6. All data are shown as mean ± SEM. Mean values of the Sham group were normalized to 1.0
