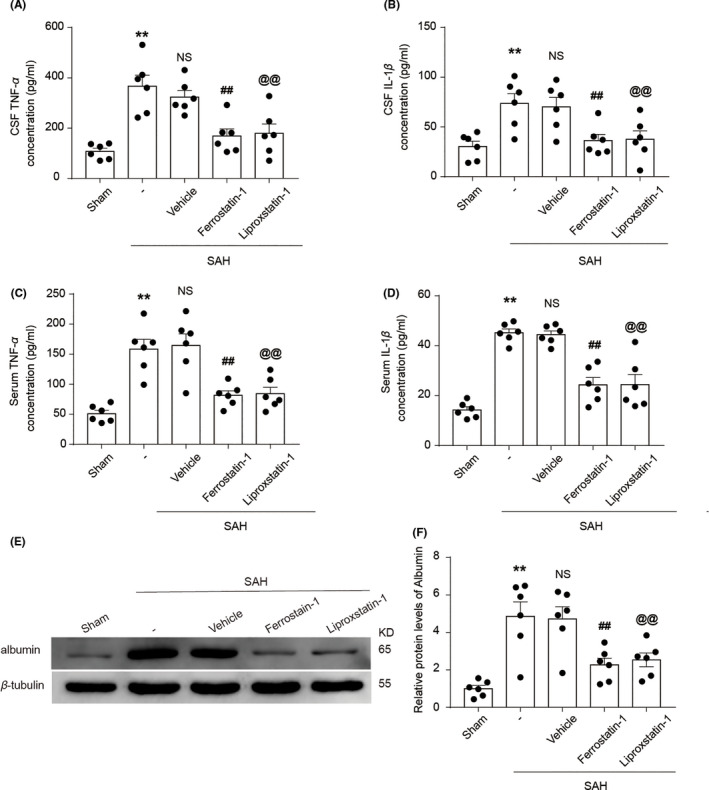
FIGURE 4.

(A) Quantification analysis of TNF‐α concentration in CSF samples obtained from rats in various groups at 24 h after SAH induction. **p = 0.0002 vs. Sham group; ## p = 0.0024, @@ p = 0.0099 vs. SAH + Vehicle group; results analyzed using unpaired t‐test, n = 6. NS, no significant difference (p = 0.4169) vs. SAH group; unpaired t‐test, n = 6. (B) Quantification analysis of IL‐1β concentration in CSF samples obtained from rats in various groups. **p = 0.0030 vs. Sham group; ## p = 0.0137, @@ p = 0.0284 vs. SAH + Vehicle group; results analyzed using unpaired t‐test, n = 6. NS, no significant difference (p = 0.8027) vs. SAH group; unpaired t‐test, n = 6. (C) Quantification analysis of TNF‐α concentration in blood samples obtained from rats in various groups at 24 h after SAH induction. **p = 0.0001 vs. Sham group; ## p = 0.0026, @@ p = 0.0047 vs. SAH + Vehicle group; results analyzed using unpaired t‐test, n = 6. NS, no significant difference (p = 0.8128) vs. SAH group; unpaired t‐test, n = 6. (D) Quantification analysis of IL‐1β concentration in blood samples obtained from rats in various groups at 24 h after SAH induction. **p < 0.0001 vs. Sham group; ## p = 0001, @@ p = 0.0010 vs. SAH + Vehicle group; results analyzed using unpaired t‐test, n = 6. NS, no significant difference (p = 0.7443) vs. SAH group; unpaired t‐test, n = 6. (E) Western blotting shows albumin levels in brain tissue of rats in the Sham, SAH, SAH + Vehicle, SAH + Ferrostatin‐1, and SAH + Liproxstatin‐1 groups at 24 h after SAH induction. (F) Quantification analysis of relative albumin levels in various groups. **p = 0.0006 vs. Sham group; ## p = 0.0076, @@ p = 0.0147 vs. SAH + Vehicle group; results analyzed using unpaired t‐test, n = 6. NS, no significant difference (p = 0.8951) vs. SAH group; unpaired t‐test, n = 6. All data are shown as mean ± SEM. Mean values of the Sham group were normalized to 1.0
