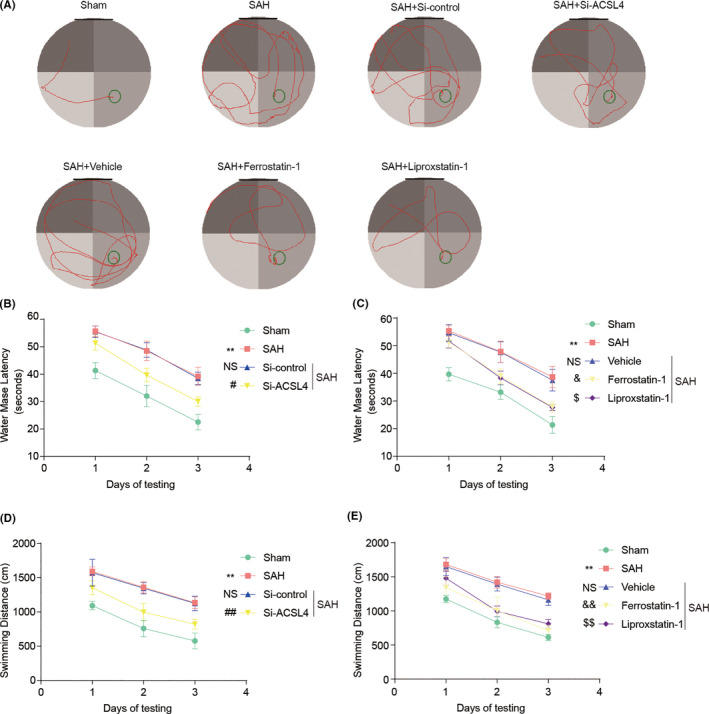
FIGURE 6.

(A) Representative images of the Sham, SAH, SAH + Si‐control, SAH + Si‐ACSL4, SAH + Vehicle, SAH + Ferrostatin‐1, and SAH + Liproxstatin‐1 in the Morris water maze test. (B, C) Quantification analysis of the escape latency of rats in various groups. In B, **p < 0.0001 vs. Sham group; NS, no significant difference (p > 0.9999) vs. SAH group; # p = 0.0121 vs. SAH + Si‐control group; two‐way repeated‐measures ANOVA, row factor: groups, p < 0.0001; column factor: days, p < 0.0001; interactions: p = 0.9678. n = 6. In C, **p < 0.0001 vs. Sham group; NS, no significant difference (p > 0.9999) vs. SAH group; & p = 0.0281, $ p = 0.0227 vs. SAH + Vehicle group; two‐way repeated‐measures ANOVA, row factor: groups, p < 0.0001; column factor: days, p < 0.0001; interactions: p = 0.8607. n = 6. (D, E) Quantification analysis of the swimming distance of rats in various groups. In D, **p < 0.0001 vs. Sham group; NS, no significant difference (p > 0.9999) vs. SAH group; ## p = 0.0087 vs. SAH + Si‐control group; two‐way repeated‐measures ANOVA, row factor: groups, p < 0.0001; column factor: days, p < 0.0001; interactions: p = 0.9959. n = 6. In E, **p < 0.0001 vs. Sham group; NS, no significant difference (p > 0.9999) vs. SAH group; && p = 0.0002, $$ p = 0.004 vs. SAH + Vehicle group; two‐way repeated‐measures ANOVA, row factor: groups, p < 0.0001; column factor: days, p < 0.0001; interactions: p = 0.9648. n = 6. All data are shown as mean ± SEM
