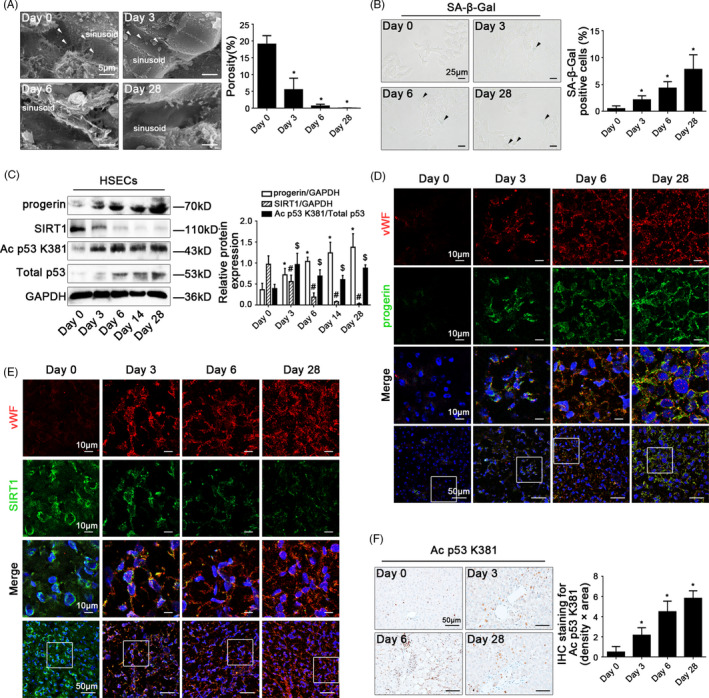
FIGURE 1.

CCl4 induces progerin‐associated premature senescence in defenestrated HSECs during liver fibrogenesis. (A) Magnification of scanning electron micrograph (SEM) of hepatic sinusoidal endothelium in CCl4‐induced rat models (Day 0, Day 3, Day 6 and Day 28), revealing fenestrae structures in hepatic sinusoidal endothelium (Scale bar: 5 μm). The white triangles indicated fenestrae in hepatic sinusoidal endothelium. The porosity of hepatic sinusoidal endothelium was quantified in the graph, right. * P < .05 vs Day 0. (B) The SA‐β‐Gal activity on primary HSECs, isolated from CCl4‐induced rat models (Day 0, Day 3, Day 6 and Day 28) was observed by SA‐β‐Gal staining (Scale bar: 25 μm). The black triangles indicated the SA‐β‐Gal‐positive cells. The SA‐β‐Gal‐positive cells were quantified in the graph, right. * P < .05 vs Day 0. (C) Representative immunoblots of progerin, SIRT1, Ac p53 K381 and total p53 of primary HSECs, isolated from CCl4‐induced rat models (Day 0, Day 3, Day 6, Day 14 and Day 28). The relative protein expression of progerin and SIRT1, as well as the ratio of Ac p53 K381 and total p53 protein levels were quantified in the graph, right. * P < .05 vs progerin relative protein level on Day 0; # P < .05 vs SIRT1 relative protein level on Day 0; $ P < .05 vs the ratio of Ac p53 K381 and total p53 protein levels on Day 0. (D) The immunofluorescent co‐localization of vWF (red) with progerin (green) of liver biopsy specimens in CCl4‐induced rat models (Day 0, Day 3, Day 6 and Day 28), visualized by confocal microscopy (Scale bar: 10 μm, 50 μm). Nuclear was showed by DAPI (blue). (E) The immunofluorescent co‐localization of vWF (red) with SIRT1 (green) of liver biopsy specimens in CCl4‐induced rat models (Day 0, Day 3, Day 6 and Day 28), visualized by confocal microscopy (Scale bar: 10 μm, 50 μm). Nuclear was showed by DAPI (blue). (F) The immunohistochemical (IHC) staining for Ac p53 K381 of liver biopsy specimens in CCl4‐induced rat models (Day 0, Day 3, Day 6 and Day 28; Scale bar: 50 μm). The semi‐quantitative score of IHC staining for Ac p53 K381 was in the graph, right. * P < .05 vs Day 0. n = 6 per group
