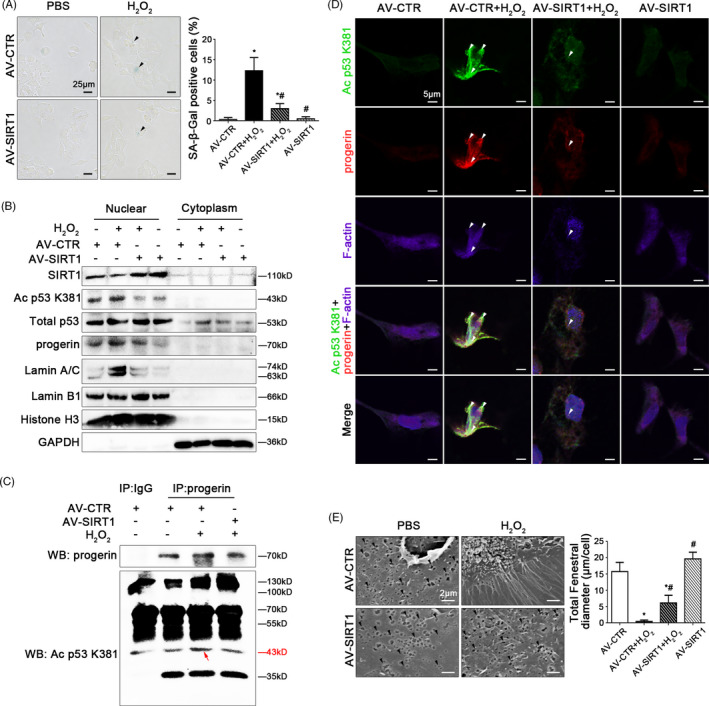
FIGURE 8.

SIRT1‐mediated deacetylation maintains fenestrae in HSECs via inhibiting progerin‐associated premature senescence. Freshly primary HSECs, isolated from normal rats and cultured in vitro, were transfected with the SIRT1 adenovirus vector to overexpress SIRT1 (called AV‐SIRT1) or nontarget adenovirus vector (called AV‐CTR), and then treated with H2O2 (10 μM) for two days. (A) The SA‐β‐Gal activity in HSECs on Day 2 in the four groups (AV‐CTR, AV‐CTR + H2O2, H2O2 + AV‐SIRT1, AV‐SIRT1) was observed by SA‐β‐Gal staining (Scale bar: 25 μm). The black triangles indicated the SA‐β‐Gal‐positive cells. The SA‐β‐Gal‐positive cells were quantified in the graph, right. * P < .05 vs the AV‐CTR group; # P < .05 vs the AV‐CTR + H2O2 group. (B) Primary HSECs were extracted nuclear and cytoplasmic protein and were detected their protein levels. Representative immunoblots of SIRT1, Ac p53 K381, total p53, progerin, Lamin A/C and Lamin B1 in nuclei and cytoplasm of HSECs in four groups (AV‐CTR, AV‐CTR + H2O2, AV‐SIRT1 + H2O2, AV‐SIRT1). (C) Interaction of progerin with Ac p53 K381 was detected by the co‐IP assay. Progerin of HSECs was individually immunoprecipitated, as well as Ac p53 K381 and progerin subjected to immunoblotting analysis as indicated. (D) The immunocytochemical co‐localization of Ac p53 K381 (green) with progerin (red) and F‐actin (purple) in primary HSECs on Day 2 in four groups (AV‐CTR, AV‐CTR + H2O2, AV‐SIRT1 + H2O2, AV‐SIRT1), visualized by confocal microscopy (Scale bar: 5 μm). Nuclear was showed by DAPI (blue). (E) Magnification of SEM of HSECs in the four groups (AV‐CTR, AV‐CTR + H2O2, AV‐SIRT1 + H2O2, AV‐SIRT1), revealing fenestrae structures in HSECs (Scale bar: 2 μm). The black triangles indicated fenestrae in HSECs. The total fenestral diameter was quantified in the graph, right. * P < .05 vs the AV‐CTR group; # P < .05 vs the AV‐CTR + H2O2 group
