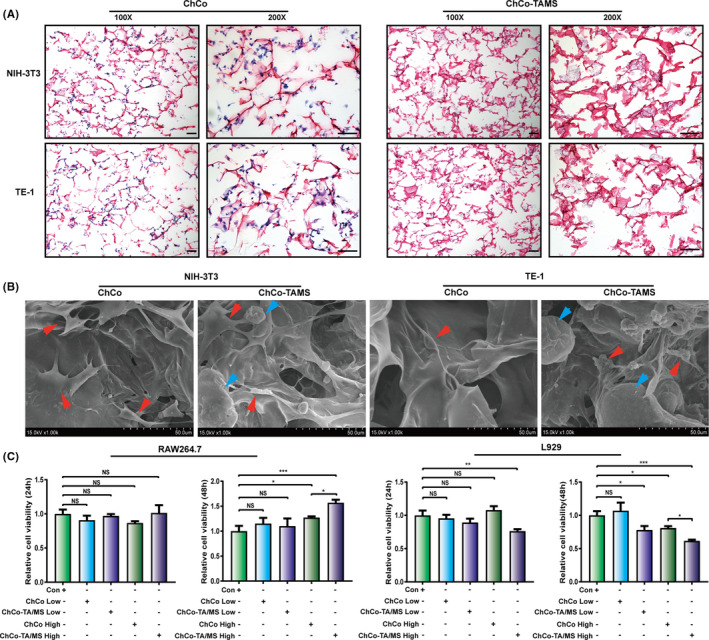
FIGURE 3.

Determination of the cell adhesion and viability on ChCo‐based scaffolds (A) NIH‐3T3 and TE‐1 cells were seeded in the ChCo‐based scaffolds for 5 days, followed by H&E staining; scale bar, 100 μm. (B) Cells attached scaffolds were evaluated by SEM; the red arrows indicated the adhered cells, and blue arrows indicated the attached PLGA/TA microspheres. (C) Identification of the cell viabilities of RAW264.7 and L929 in the presence of the ChCo‐based scaffolds at different concentrations and indicated time intervals. The representative statistical results were performed using one‐way ANOVA test and shown as means ± SEM from 3 independent experiments. *P < 0.05, **P < 0.01, ***P < 0.001, ****P < 0.0001
