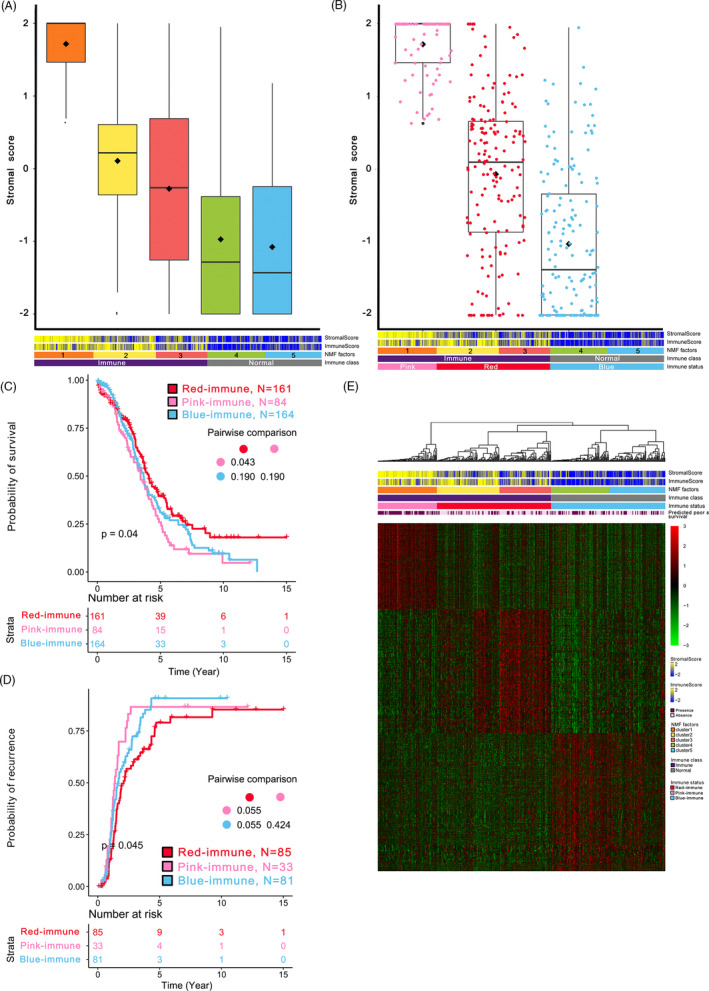
FIGURE 1.

Quantification of the stromal enrichment levels of each cNMF factor and identification of the three immune‐specific subtypes of HGSOC. A, Boxplot of the stromal enrichment score of each cNMF factor. B, Boxplot of the stromal enrichment score of the three immune‐specific subtypes. C, Kaplan‐Meier curves of overall survival of the three immune‐specific subtypes. D, Kaplan‐Meier curves of recurrence time of the three immune‐specific subtypes. E, Heatmap of the gene expression profiles derived from unique significantly overexpressed genes based on pairwise comparison. P values was adjusted by Benjamini‐Hochberg in pairwise comparison of survival
