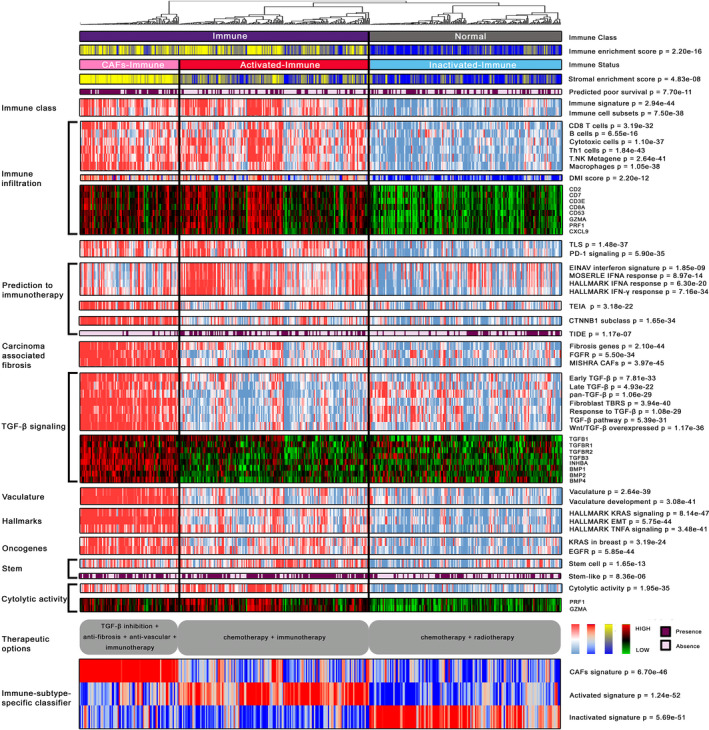
FIGURE 2.

Characterization of the molecular landscape of the immune‐specific subtypes of HGSOC. A total of 418 HGSOC samples from TCGA training cohort were separated into immune (n = 252) and non‐immune groups (n = 166) by consensus non‐negative matrix factorization; the immune nature of the former was supported by gene signatures that reflect immune cells, infiltration and PD‐1 signalling. Immune group contains two microenvironment‐based subtypes, the activated‐immune (n = 166) and CAFs‐immune (n = 86) subtypes. The CAFs‐immune subtype was enriched for transforming growth factor beta 1 signalling, carcinoma‐associated fibroblasts and vasculature development that mediate immunosuppression. In the comprehensive heatmap, IES and SES were estimated by ‘estimator’ approach, continuous scores for molecular pathways were calculated by single‐sample gene set enrichment analysis, continuous expression level for genes was represented by log2‐transformed FPKM values, and binary classification of molecular phenotype was predicted by NTP algorithm; continuous values were further z‐scored and presented in the heatmap. High and low estimated IES and SES are presented in yellow and blue, respectively; high and low single‐sample enrichment scores as well as DNA methylation‐based immune infiltration scores are represented in red and blue, respectively; gene expression level was mapped to red and green colour range; the presence of feature predicted by NTP was indicated in purple. Opportunities for personalized therapy of each subtype are portrayed below in grey round box, and the single‐sample enrichment score of immune subtype‐specific classifier was drawn in the bottom of this heatmap. DMI, DNA methylation‐based immune infiltration; TLS, tertiary lymphoid structure; IFN: interferon; TIDE: tumour immune dysfunction and exclusion; TEIA: tumour escape from immune attack; CAFs: carcinoma‐associated fibroblasts; EMT: epithelial‐mesenchymal transition; TNFA: tumour necrosis factor‐alpha
