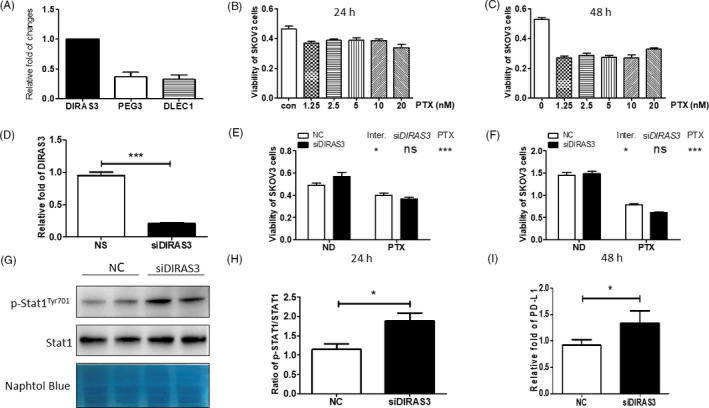
FIGURE 4.

Benchmarking of cell lines, including characteristics of the human ovarian cancer cell line SKOV3, activation of STAT1 in DIRAS3‐knockdown SKOV3 cells, and increased PD‐L1 expression in DIRAS3‐knockdown SKOV3 cells. A, DIRAS3, PEG3 and DLEC1 expression in SKOV3 cells. B and C Survival of SKOV3 cells treated with PTX at different concentrations for 24 and 48 h. D, Efficiency of DIARS3 knockdown with siRNA transfection. E) and F) Survival of SKOV3 cells treated with 20 nM PTX after transfection with NC or siDIRAS3. *P < 0.05; ***P < 0.001 (two‐way ANOVA followed by a Bonferroni post hoc test). G, Protein levels of p‐STAT1 and STAT1 in SKOV3 cells transfected with NC or siDIRAS3. H, p‐STAT1/STAT1 ratio. *P < 0.05 (Student's t test). I, SKOV3 cells were transfected with NC or siDIRAS3 and PD‐L1 was quantified by real‐time PCR. *P < 0.05 (Student's t test)
