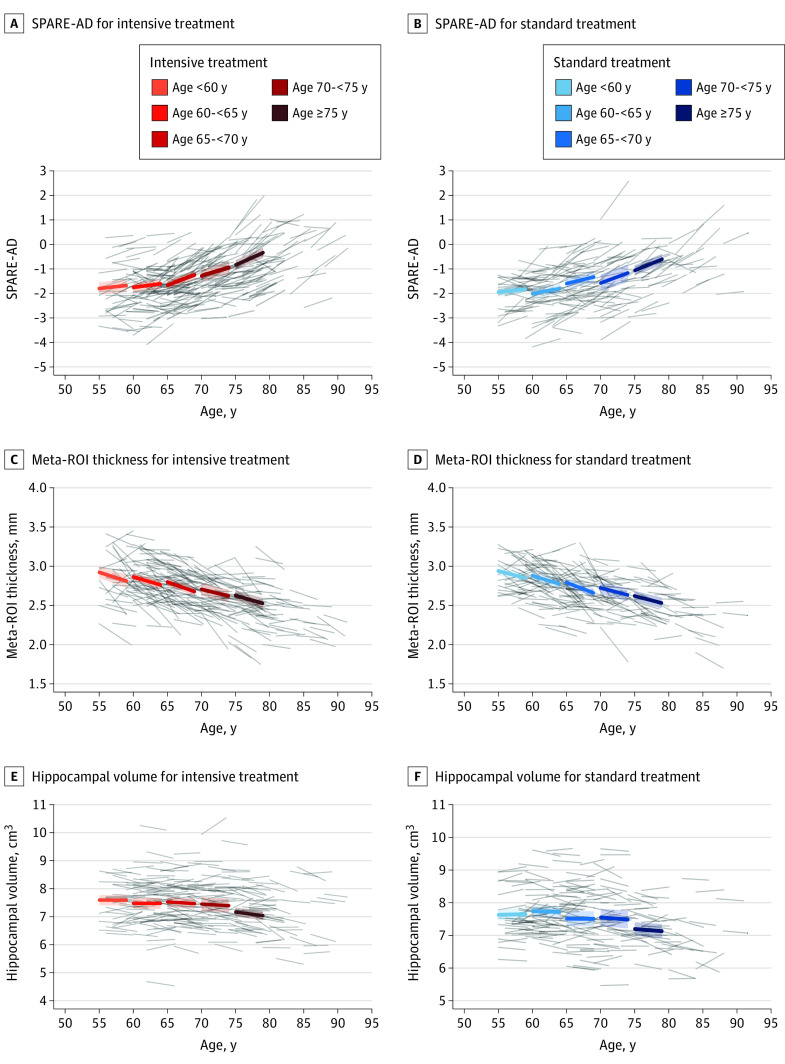
Figure 2. Longitudinal Change in Alzheimer Disease Magnetic Resonance Imaging Biomarkers by Age and Treatment Group.
Bold lines represent age-specific change for each measurement estimated from a treatment group specific linear mixed model, with associated 95% CIs. Gray lines represent individual participant trajectories. ROIs indicate regions of interest; SPARE-AD, spatial pattern for recognition of Alzheimer disease.

