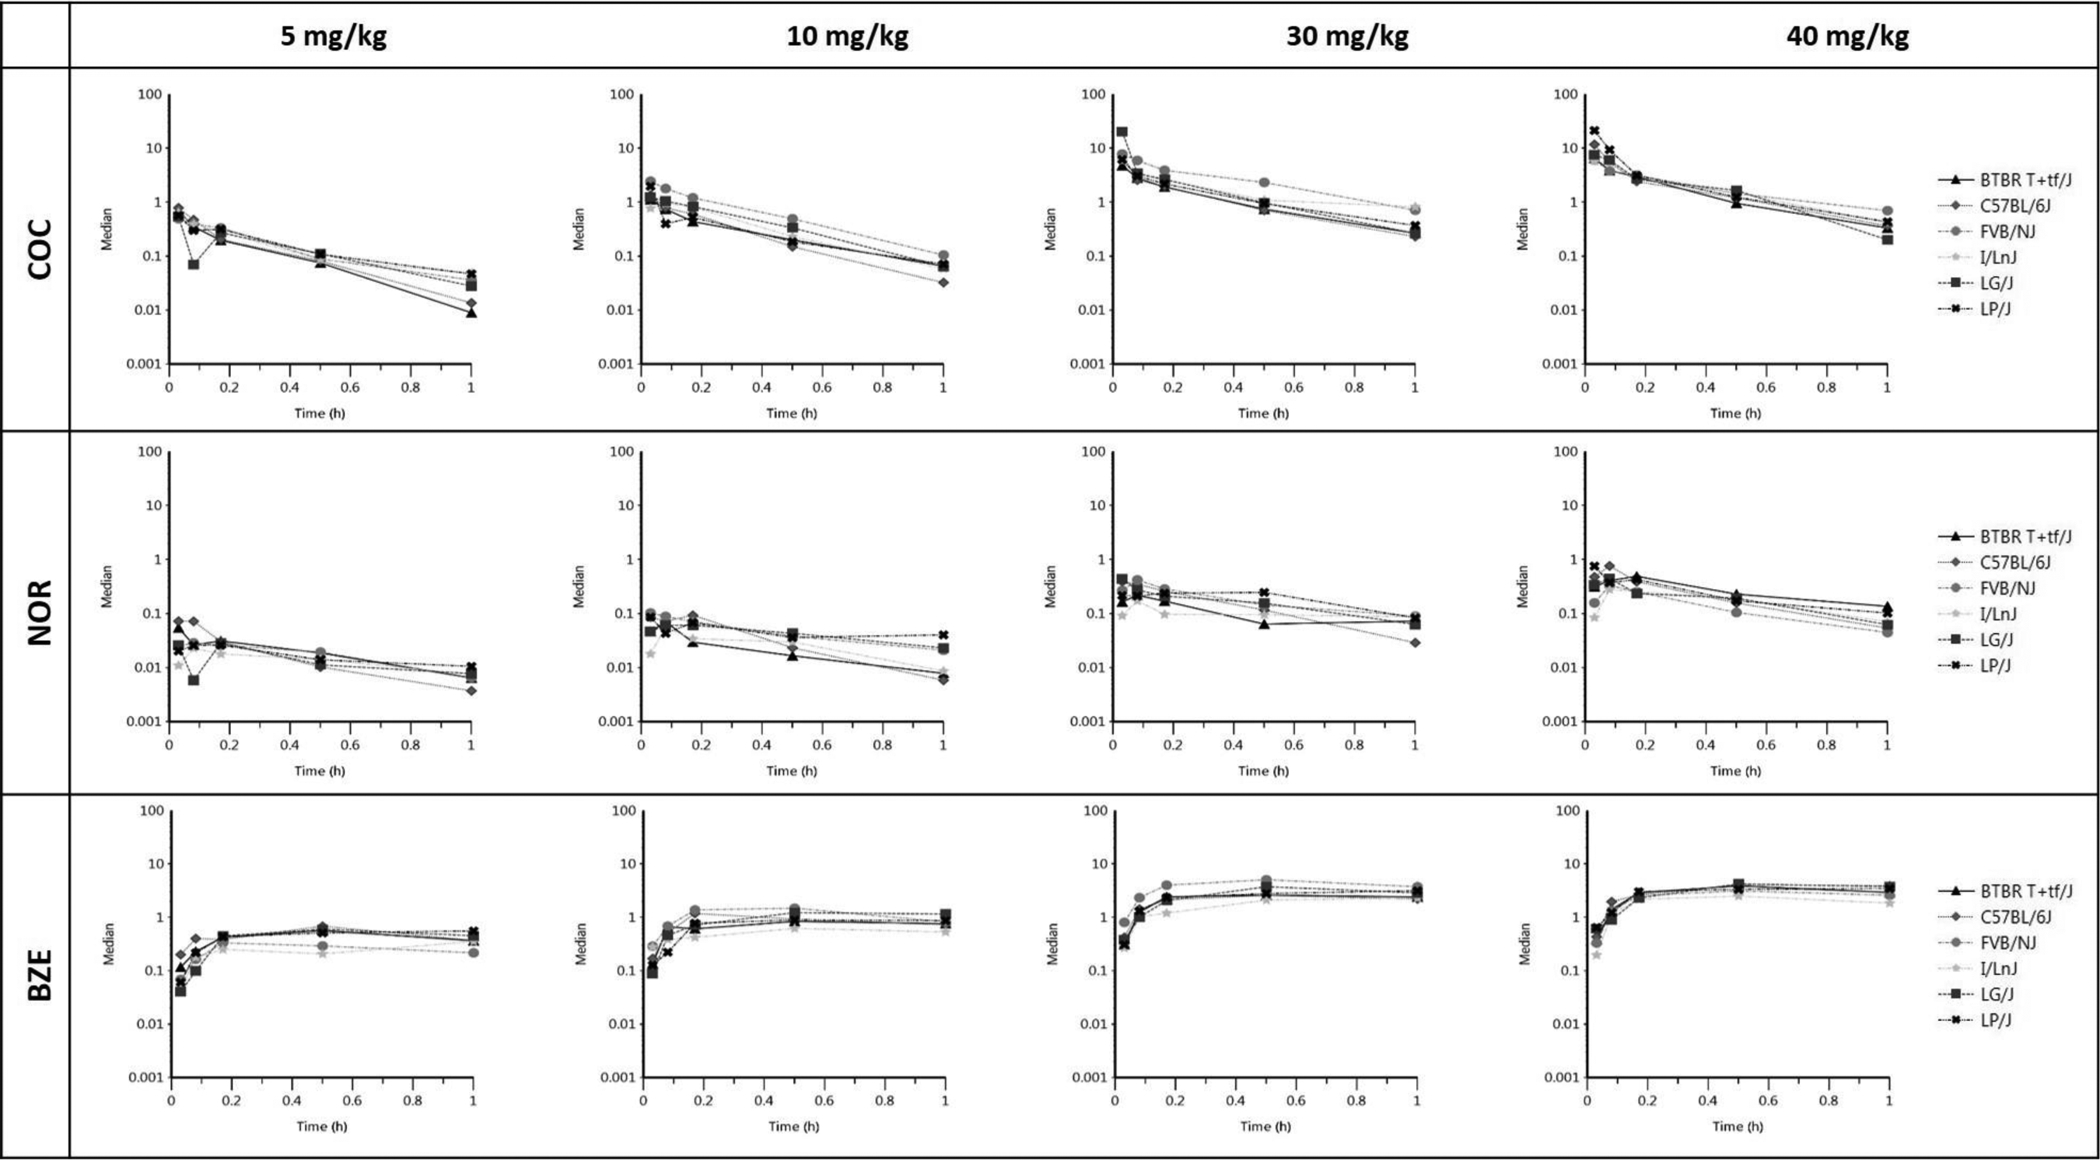
Figure 3. XY plots for COC, NOR and BZE in brain.

Each of the 12 graphs represents concentration versus time for the various analyte (COC, NOR, and BZE) and dose combinations. Each line on the graph corresponds to an individual FPM and each data point on the line represents the concentration of the corresponding analyte in the brain (ng/g) at the specific time (0.03, 0.08, 0.17, 0.5 and 1-hr) post COC injection at dose indicated. Median concentrations from the biological triplicate were used for each strain, dose and time combination.
