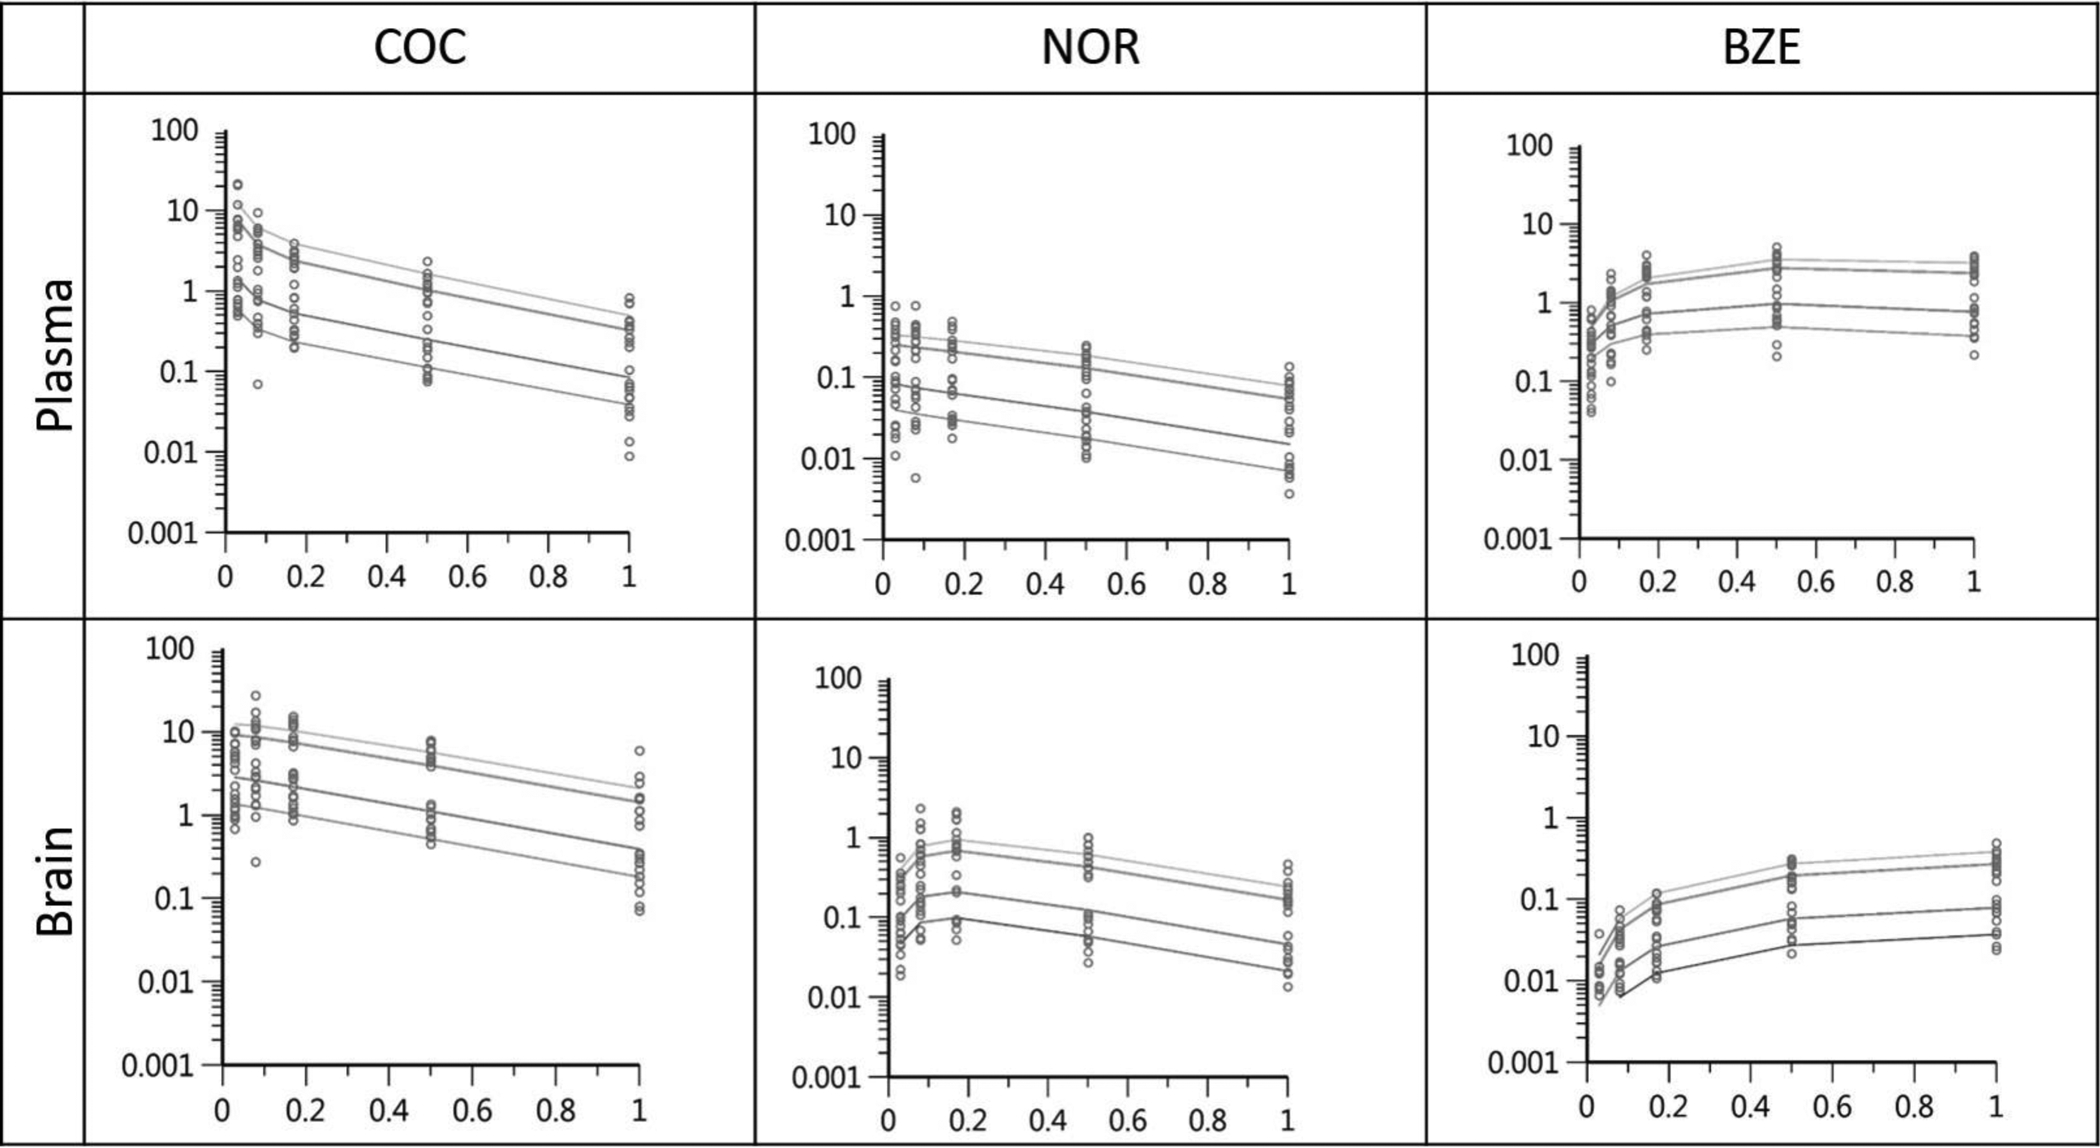
Figure 5. PK model diagnostic plots.

Predicted concentrations of COC, NOR and BZE in plasma and brain are depicted with a line and observed data were overlaid on top of as dots. X-axis is independent variable plotted against the Y-axis showing individually predicted dependent variables (concentrations).
