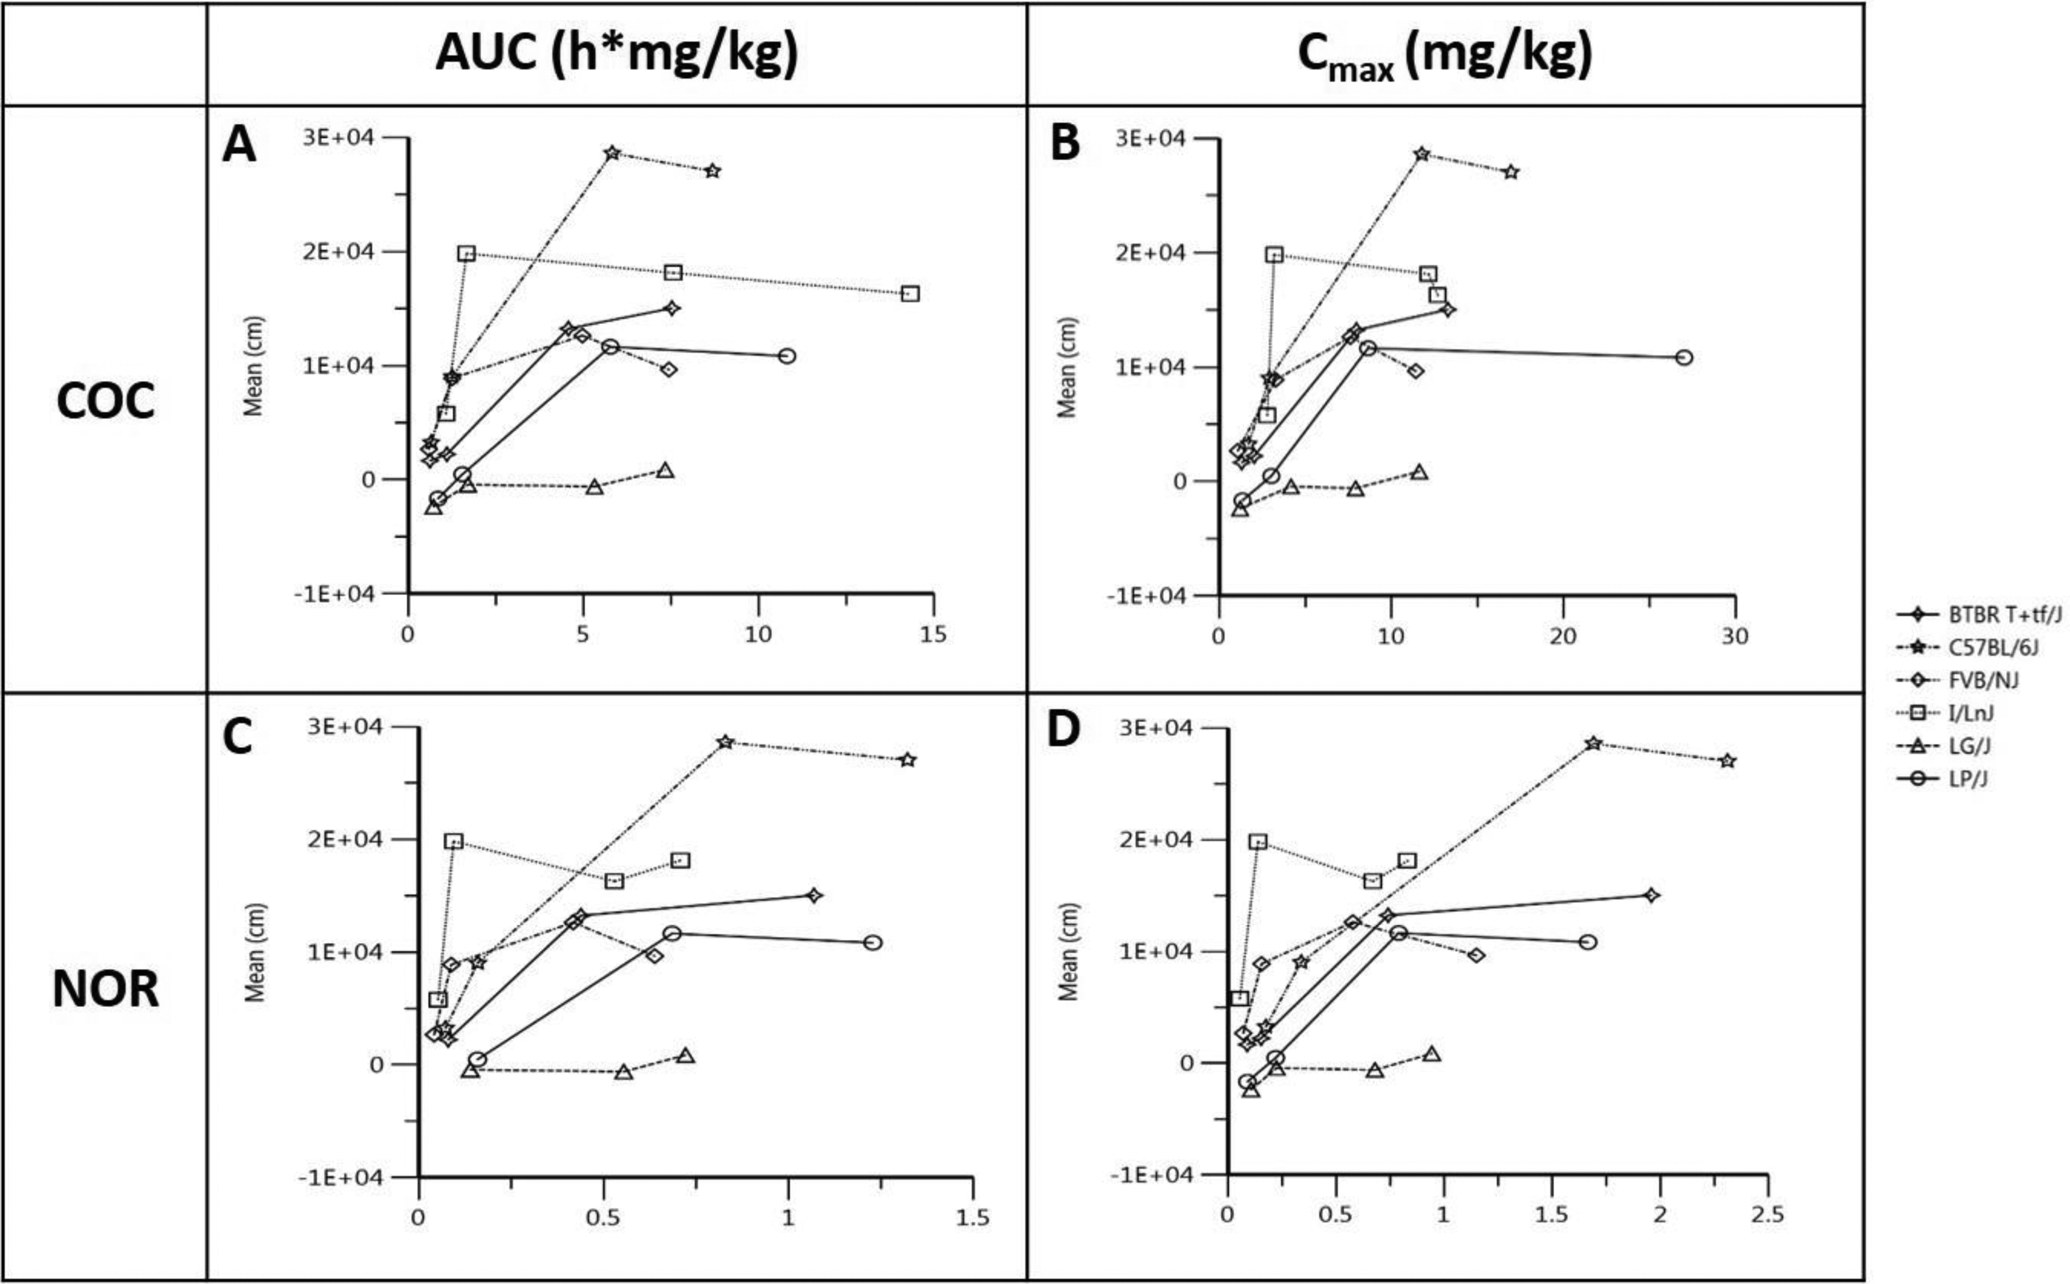
Figure 6. PKPD comparison across 6 strain for COC and NOR in the brain. Individual plots show.

PK and PD relationships for each strain. In each panel, the PK of COC and NOR are measured as AUC and Cmax and plotted against the PD endpoint, mean distance travelled in 30 min. All 4 dosing groups are stratified by strain and represented on the curve with the first data point representing 5mg/kg and the 2nd, 3rd and 4th data point representing 10, 30 and 40 mg/kg dosing groups, respectively. A: relationship between brain AUC of COC and mean distance travelled in 30 min; B: relationship between brain Cmax of COC and mean distance travelled in 30 min; C: relationship between brain AUC or NOR and mean distance travelled in 30 min; D: relationship between brain Cmax of NOR and mean distance travelled in 30 min.
