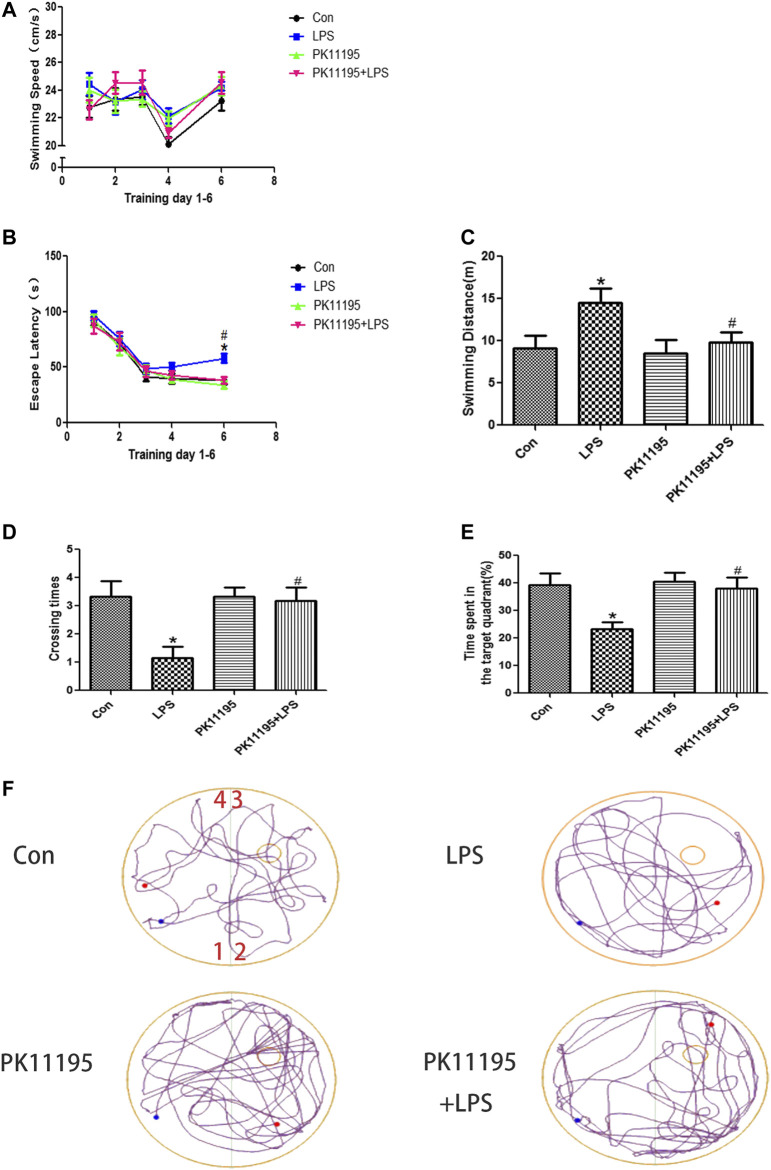
FIGURE 1.
Spatial learning and memory ability of rats in Morris water maze test. (A) swimming speed; (B) escape latency; (C) swimming distance on the sixth day; (D) crossing times; (E) time spent in the target quadrant; (F) the representative trajectory diagrams (1, 2, 3, 4: four different quadrants; Blue dots: starting position; Red dots: ending position; Small yellow circles: the previous location of the platform.); Values are presented as the mean ± standard deviation. *p < 0.05 vs. Con group; # p < 0.05 vs. LPS group (n = 10 in each group). LPS induced the expression of TSPO in the hippocampus, PK11195 attenuate this response.

