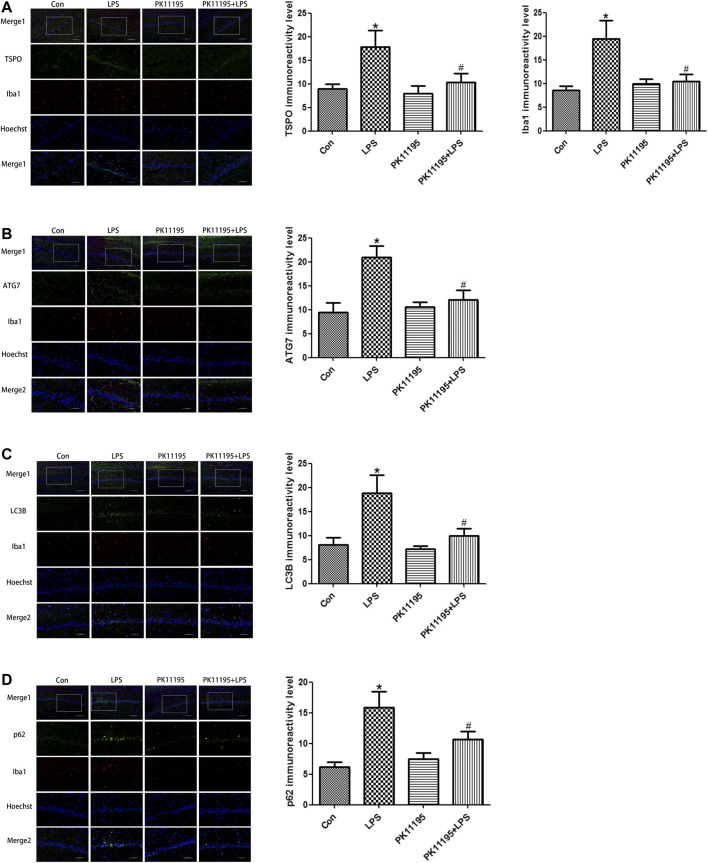
FIGURE 4.
Laser confocal microscopy showing the expression of TSPO, Iba1 and autophagy-related proteins in the rat hippocampal CA1 microglia of each group (Merge1: Bar = 100 μm, ×200, the rest: Bar = 50 μm, ×400). (A) Statistical analysis graph of each group indicating TSPO and Iba1 protein levels in the rat hippocampal CA1 microglia; Green represents TSPO, red represents Iba1 and blue represents the nuclei. (B) Statistical analysis graph of each group indicating ATG7 protein levels in the rat hippocampal CA1 microglia; Green represents ATG7, red represents Iba1 and blue represents the nuclei. (C) Statistical analysis graph of each group indicating LC3B protein levels in the rat hippocampal CA1 microglia; Green represents LC3B, red represents Iba1 and blue represents the nuclei. (D) Statistical analysis graph of each group indicating p62 protein levels in the rat hippocampal CA1 microglia; Green represents p62, red represents Iba1 and blue represents the nuclei. Values are presented as the mean ± standard deviation. *p < 0.05 vs. Con group; #p < 0.05 vs. LPS group (n = 5 in each group).

