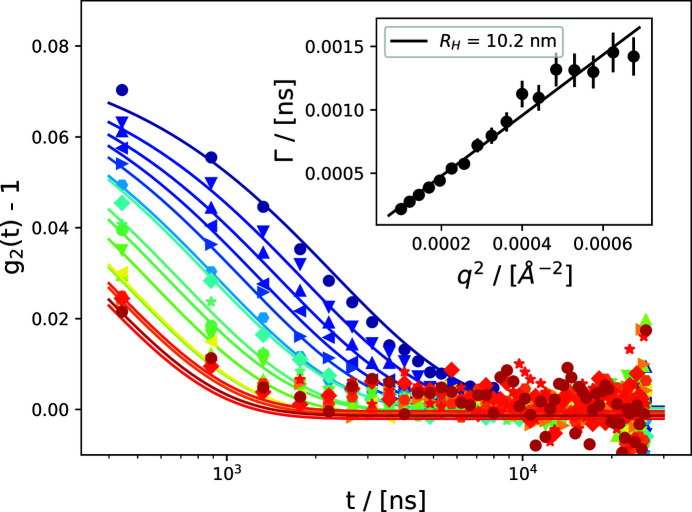
Figure 14.
Autocorrelation functions g 2(q,t) of 10 nm silica nanoparticles dispersed in water. The inset shows the dependence of the decay rate Γ as a function of q 2, illustrating diffusive behavior of the colloidal dispersion. The colorscale reflects q as given in Fig. 12 ▸.

