Figure 3.

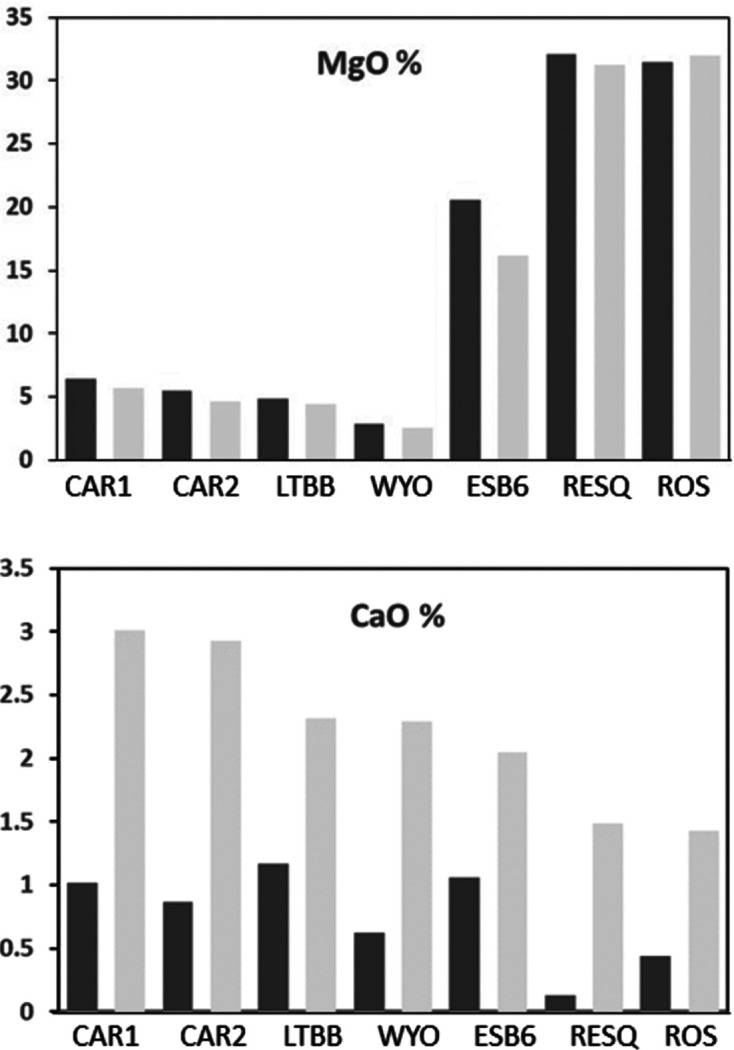
MgO and CaO content (in %) of the natural and Ca2+ homoionic samples. Note that MgO decreases and CaO increases after homoionization. Dark-grey bars show results before homoionization and light-grey bars show results after homoionization.

MgO and CaO content (in %) of the natural and Ca2+ homoionic samples. Note that MgO decreases and CaO increases after homoionization. Dark-grey bars show results before homoionization and light-grey bars show results after homoionization.