FIGURE 1.
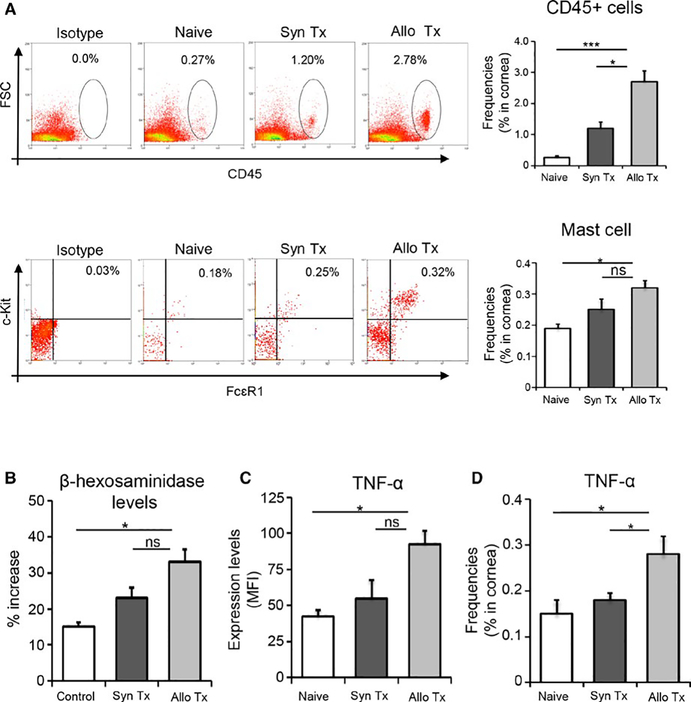
Mast cell frequencies and activation increase following transplantation. Ocular surface mucosal tissues (corneas and conjunctivae) were harvested at 6 hours posttransplantation. (A) Single cell suspensions were analyzed by flow cytometry. Upper left panel: representative dot plots showing the frequencies of CD45+ cells in ocular surface tissues harvested from naïve mice, and syngeneic (Syn Tx) and allogeneic (Allo Tx) transplant recipients. Upper right panel: bar chart demonstrating the cumulative frequency data of ocular surface CD45+ cells in transplant recipients and naïve mice (***P < .001, t test). Lower left panel: representative dot plots showing the frequencies of CD45+c-Kit+FCεR1+ mast cells at ocular surface tissues (data shown are gated on CD45+ cells). Lower right panel: bar chart demonstrating the cumulative data of frequencies of ocular surface c-Kit+FCεR1+ mast cells in transplant recipients and naïve mice (*P < .006, t test). (B) Bar chart depicting the percentage increase in β-hexosaminidase expression in the control group (nontransplanted contralateral eyes), syngeneic graft recipients, and allogeneic graft recipients (*P < .005, t test). (C) Bar chart showing protein expression (mean fluorescence intensity, MFI) of TNF-α by ocular surface mast cells from allogeneic hosts, syngeneic hosts, and naïve mice (*P < .0045, t test). (D) Bar chart showing frequencies of TNF-α-expressing cells in the corneas of allogeneic hosts, syngeneic hosts, and naïve mice (*P < .05, t test). Representative data from four independent experiments are shown and each experiment consisted of five animals. Data are represented as mean ± SEM (error bar). One-way ANOVA was used to compare multiple groups (P < .05). ns = not significant

