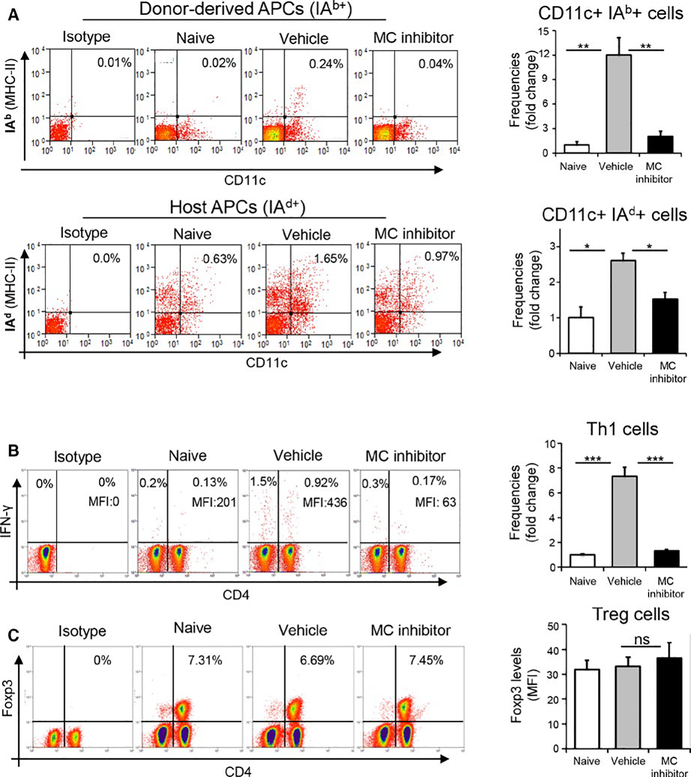
FIGURE 4.
Inhibition of mast cells limits APC maturation and Th1 generation in lymphoid tissues. (A) Representative flow cytometric dot plots (left) and cumulative bar chart (right) of fold change in the frequencies of donor-derived MHCII IAb+ (upper panel) and host-derived MHCII IAd+ (lower panel) APCs in the draining lymph nodes of naïve mice, and vehicle-treated and mast cell inhibitor-treated allograft recipients at 2 weeks posttransplantation. (B) Representative flow cytometric dot plots (left) and cumulative bar chart of fold change in the frequencies of IFNγ+CD4+ Th1 cells in the draining lymph nodes (right) of naïve, vehicle-treated, and mast cell inhibitor-treated groups at 2 weeks posttransplantation. (C) Representative flow cytometric dot plots (left) and cumulative bar chart showing protein expression (MFI) of Foxp3 by Tregs (right) in the draining lymph nodes of naïve, vehicle-treated, and mast cell inhibitor-treated groups at 2 weeks posttransplantation. Representative data from three independent experiments are shown and each experiment consisted of five animals. Data are represented as mean ± SEM (error bar). t test, *P < .05, **P < .01, ***P < .001, ns = not significant

