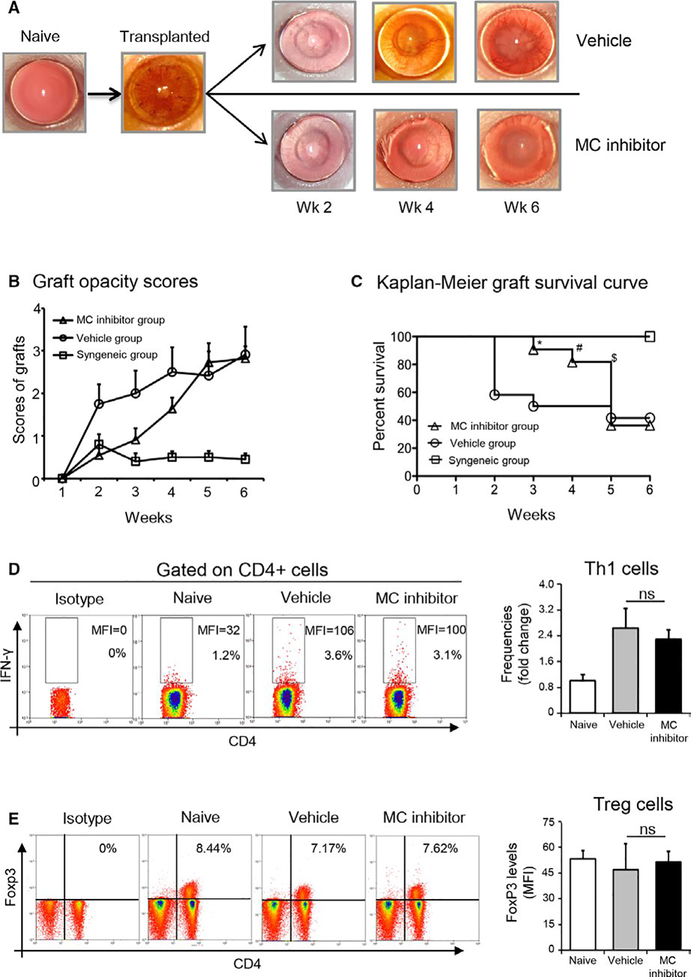
FIGURE 7.
Inhibition of mast cells prolongs corneal allograft survival. (A) Representative slit lamp biomicroscope photographs of a normal murine cornea, corneal allograft on the day of transplant surgery, and at 2, 4, and 6 weeks postoperative surgery in vehicle-treated allogeneic group and the mast cell inhibitor-treated allogeneic group. (B) Line diagram showing corneal graft opacity scores of the vehicle-treated allogeneic group and the mast cell inhibitor-treated allogeneic group. (C) Kaplan-Meier graft survival curves for the syngeneic group, the vehicle-treated allogeneic group and the mast cell inhibitor-treated allogeneic group (n = 10 in each group; log-rank test; *P < .015, **P < .03, ***P < .05). (D) Representative flow cytometric dot plots showing frequencies and expression levels (MFI) of IFNγ in CD4+ T cells (left panel). Cumulative bar chart showing fold change in the frequencies of IFNγ+CD4+ Th1 cells in the draining lymph nodes of naïve, vehicle-treated, and mast cell inhibitor-treated groups at 6 weeks posttransplantation (right panel). (E) Representative flow cytometric dot plots showing frequencies of CD4+Foxp3+ Tregs (left panel). Bar chart showing protein expression (MFI) of Foxp3 by Tregs in the draining lymph nodes of naïve, vehicle-treated, and mast cell inhibitor-treated groups at 6 weeks posttransplantation (right panel). Representative data from two independent experiments are shown and each experiment consisted of 10 animals. Data are represented as mean ± SEM (error bar). t test, ns =not significant

