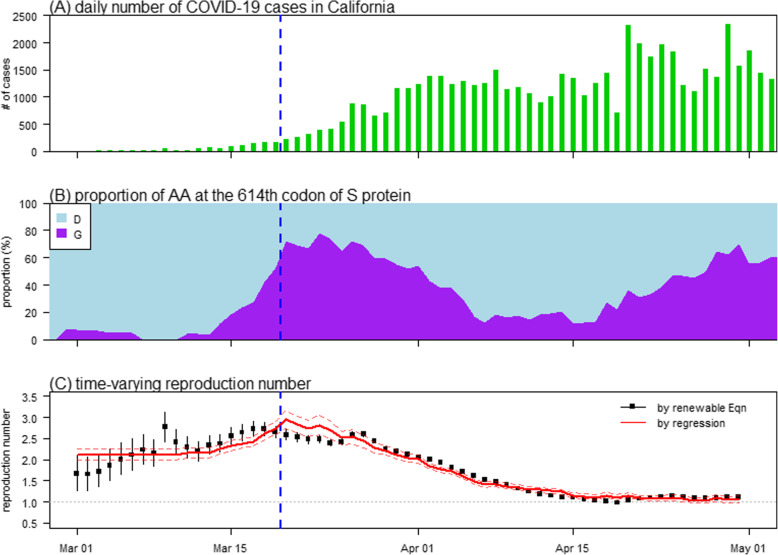
Fig. 1.
The number of COVID-19 cases (panel A), prevalence of the amino acids (AA) on the 614-th codon of the S protein (panel B), and time-varying reproduction number (Rt, panel C) in California from March to April 2020. Panel A shows the daily number of COVID-19 time series. Panel B shows the prevalence of the AAs, including Aspartic Acid (D, in cyan) and Glycine (G, in purple), on the 614-th codon of the S protein. Panel C shows the Rt estimated (black) from the number of cases data using renewable equation and fitted (red) by using the mutation activity on the 614-th codon of the S protein in panel B. In each panel, the vertical dashed blue line represents the date, March 19, when the ‘stay-at-home’ order was officially implemented in California

