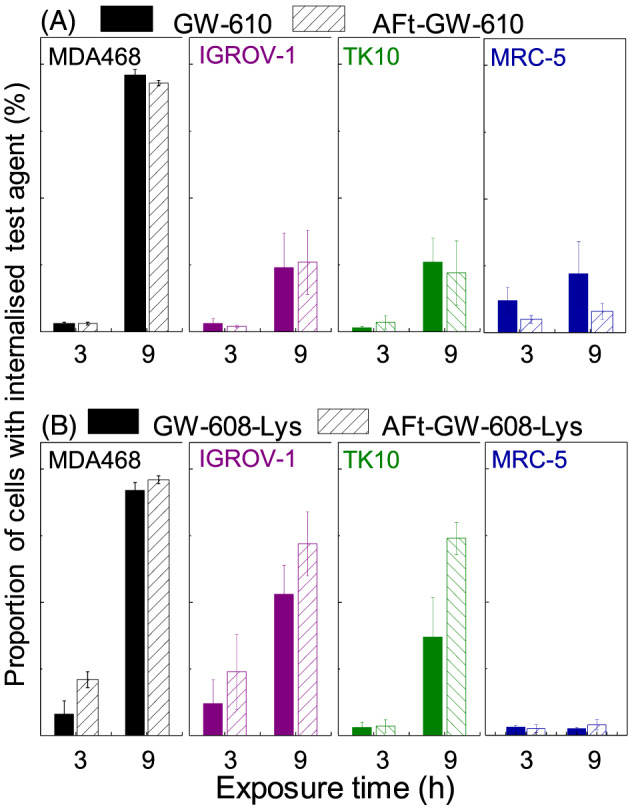
Figure 3.

Proportion of cells with intracellular agent in MDA‐468, IGROV‐1, and TK10 carcinoma cell lines and MRC‐5 fibroblasts determined as number of cells with detectable fluorescence of the agent. Cells treated with 1μM concentration of test agent for 3 and 9 h. Results are shown for test agents A, GW 610 and AFt‐GW 610 and B, GW 608‐Lys and AFt‐GW 608‐Lys. Data points are mean ± standard deviation (SD), from three independent trials. For sensitive carcinoma cell lines significant enhancement on uptake is observed for Lys‐conjugated agent compared with insensitive MRC‐5 cells (P < 0.001; exemplified also in Figure S7)
