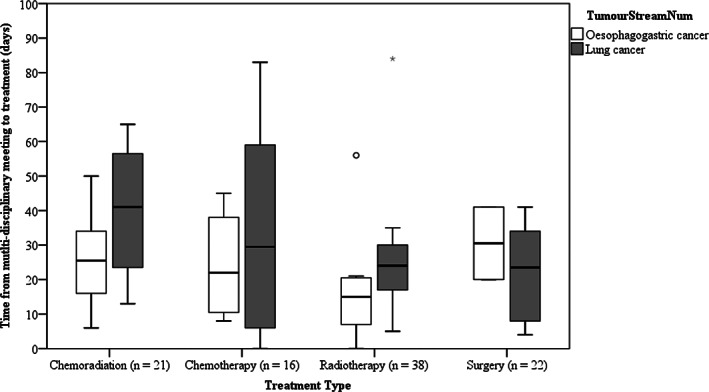
FIGURE 1.

The time taken from multi‐disciplinary meeting to treatment based on the type of treatment. The box‐plots show the five‐number summary statistics: minimum, lower quartile (25th percentile), median, upper quartile (75th percentile) and maximum. (outliers are indicated by o and *)
