Figure 1.

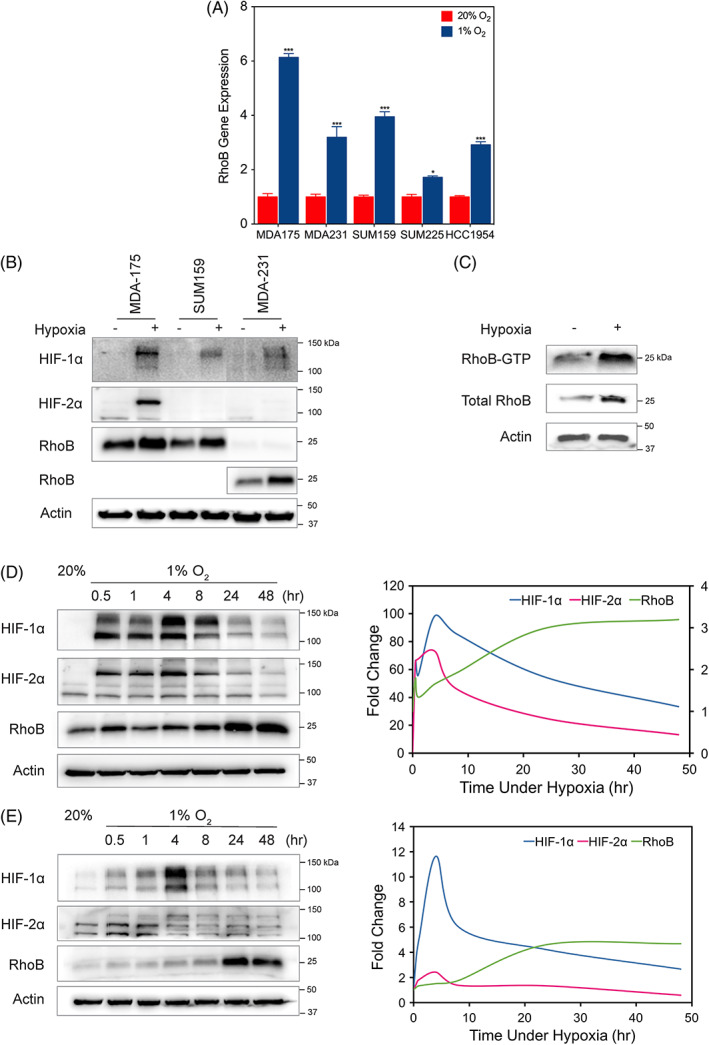
Hypoxia induces RhoB mRNA, protein, and activated RhoB protein levels. A, RhoB mRNA levels were analyzed by quantitative polymerase chain reaction in MDA‐MB‐175, MDA‐MB‐231, SUM159, SUM225, and HCC1954 breast cancer cell lines and exposed to 20% or 1% O2 for 24 h, normalized to the mean value for each of the cell lines at 20% O2. Data are shown as mean ± standard error of mean, n = 3; *, P < 0.05; ***, P < 0.001 vs. 20% O2 conditions (Student's t test). B, Immunoblot assay was performed using lysates prepared from MDA‐MB‐175, SUM159, and MDA‐MB‐231 cells exposed to 20% or 1% O2 for 48 h to assess the levels of HIF‐1α, HIF‐2α, and RhoB. Note that a 10x higher exposure time was used for RhoB protein expression in MDA‐MB‐231 cells. C, RhoB‐GTP pulldown assay was performed to detect levels of activated RhoB in MDA‐MB‐231 cells exposed to either 20% O2 or 1% O2 conditions. The amount of activated or total RhoB was detected by immunoblotting with a RhoB antibody. Immunoblot assay of (D) SUM159 or (E) MDA‐MB‐231 lysates exposed to 20% or 1% O2 for various time points over a 48‐h time course (left panel). HIF‐1α, HIF‐2α, and RhoB densitometry measurements normalized by actin levels were plotted (right panel). Molecular weights of adjacent ladder bands are indicated
