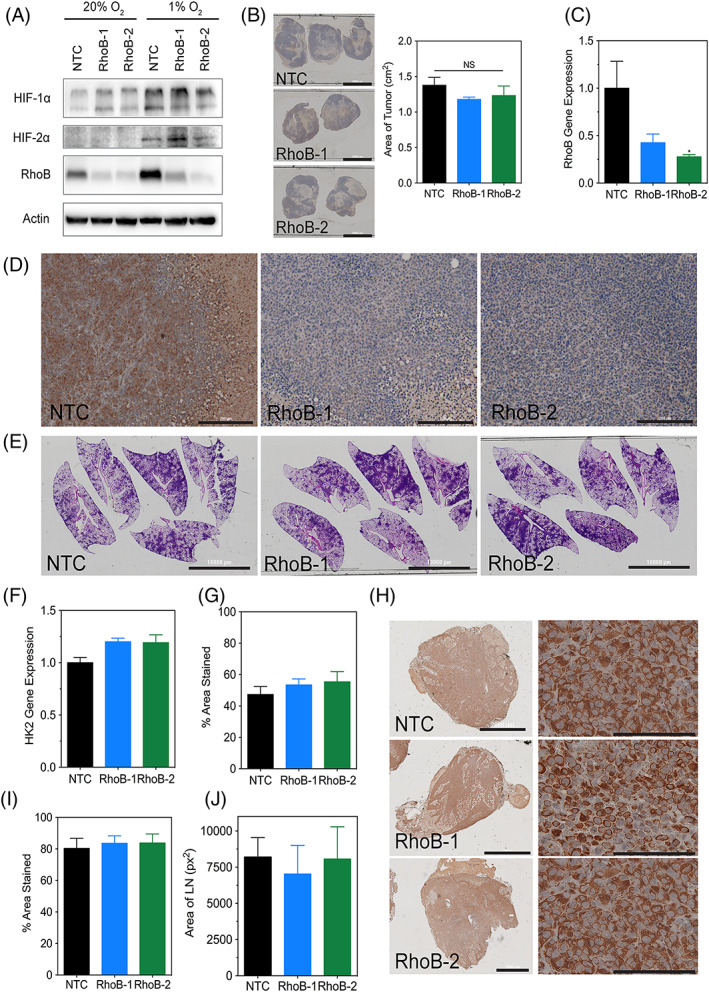
Figure 4.

RhoB knockdown does not affect tumor growth or metastasis in vivo. A, Immunoblot assays were performed using lysates prepared from MDA‐MB‐231 nontarget control, RhoB‐1, and RhoB‐2 subclones exposed to 20% or 1% O2 for 48 h and to assess the levels of HIF‐1α, HIF‐2α, and RhoB. Molecular weights of adjacent ladder bands are indicated. B, Tumor sections for the indicated subclones of MDA‐MB‐231 cells that were injected into the mammary fat pad of NSG mice were stained for hematoxylin (scale bar = 10 000 μm) and their respective areas were measured using ImageJ software. Data are shown as mean ± standard error of mean; n = 5 (one‐way analysis of variance with Bonferroni posttest). C, Human RhoB content in the tumors was quantified by quantitative polymerase chain reaction. Data are shown as mean ± standard error of mean; n = 5. *, P < 0.05 vs. nontarget control (one‐way analysis of variance with Bonferroni posttest). D, Tumor sections (scale bar = 200 μm) were subjected to IHC using an antibody against RhoB. E. Whole‐mount inflated lungs (scale bar = 10 000 μm) were stained with hematoxylin and eosin to identify metastatic foci. F, Human genomic DNA content in the lungs was quantified by quantitative polymerase chain reaction for human HK2 gene sequences. G, The percent area stained for hematoxylin for each lung was measured using ImageJ software (see SF5A). Data are shown as mean ± standard error of mean; n = 5 (one‐way analysis of variance with Bonferroni posttest). H, Ipsilateral lymph node sections (scale bar = 2000 μm) were subjected to IHC using an antibody specific for human vimentin. Magnified images (scale bar = 100 μm) are shown on the right. (I) The percent area stained for vimentin and (J) the total area for each lymph node were measured using ImageJ software (see SF5B). Data are shown as mean ± standard error of mean; n = 4–7 (one‐way analysis of variance with Bonferroni posttest)
