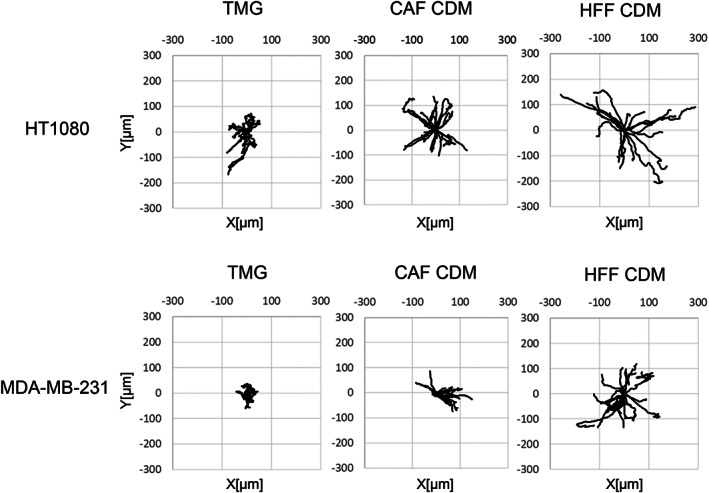
FIGURE 7.

Wind rose plots of HT1080 and MDA‐MB‐231 cells migration tracks in TMG and CDM. The starting points of migration are superimposed at the origin, and the tracks are displayed as outwardly oriented tracings. n = 20. TMG: tissue matrix gel, CDM: cell‐derived matrix, CAF: cancer‐associated fibroblast, HFF: human foreskin fibroblast
