
Figure 3.
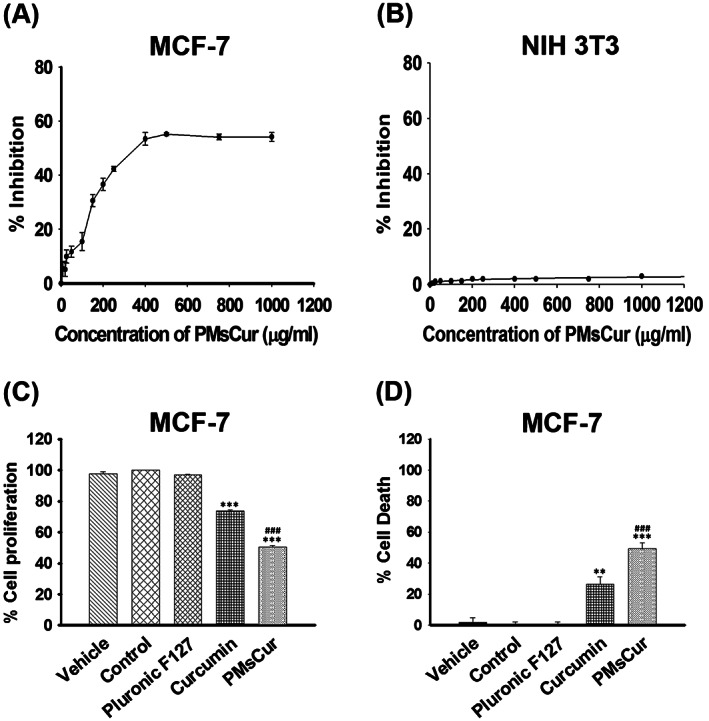
Anti‐proliferative effect of Pluronic F127, curcumin, and PMsCur. A,B, To determine IC50 value, A, MCF‐7 and B, NIH 3T3 cells were treated with wide range of concentrations (10, 20, 25, 50, 100, 150, 200, 250, 400, 500, 750, and 1000 μg/mL) of PMsCur for 24 h. Inhibition of cell proliferation was evaluated by MTT assay. C,D, The antiproliferative efficiency of PMsCur on MCF‐7 cells was evaluated by MTT and trypan blue assay. Cells were treated with Pluronic F127 (364 μg/mL), curcumin (5.66 μg/mL), and PMsCur (364 μg/mL) for 24 h. Vehicle control contained 0.02% DMSO, and control represents untreated cells. C, Evaluation of cell proliferation by MTT assay. The bar graphs represent percentage of cell proliferation. D, Evaluation of cell death by trypan blue assay. The bar graphs represent the percentage of cell death. Error bars represent ± SEM of three independent experiments. Significance indicated as **P ≤ 0.01, ***P ≤ 0.001 between untreated cells and treated cells and ### P ≤ 0.001 between free curcumin and PMsCur‐treated cells by performing one‐way ANOVA followed by Student‐Newman‐Keuls multiple comparisons test. Auto‐fluorescence of curcumin was normalized to avoid interference