FIGURE 2.

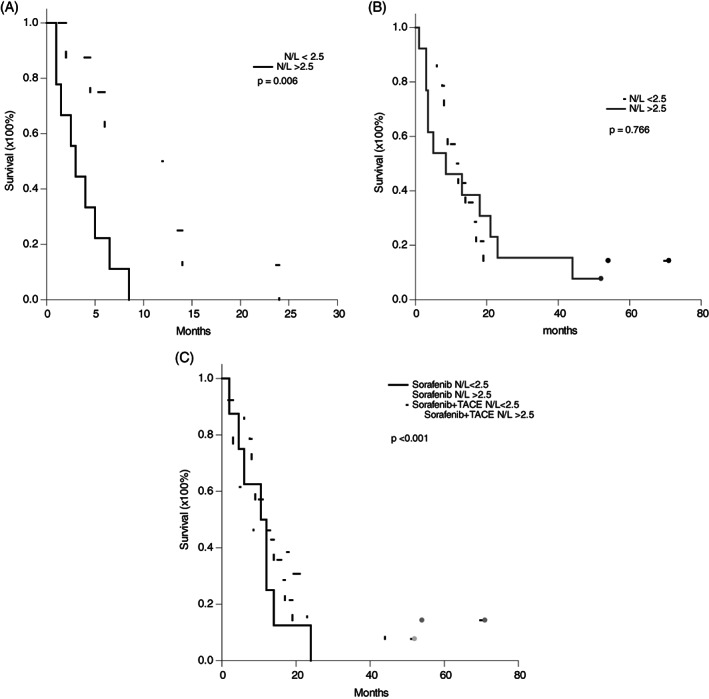
Kaplan–Meier survival curve of the patients based on neutrophil‐to‐lymphocyte ratio. A, For the patients in group A treated by sorafenib, the 3‐month, 6‐month, 1‐year and 2‐year survival for the patients with N/L < 2.5 were 87.3%, 62.5%, 25.0% and 0%, respectively, compared to 44.4%, 22.2%, 0% and 0% for the patients with N/L ≥ 2.5 (P = .006). B, For the patients in group B treated by sorafenib with TACE, the 3‐month, 6‐month, 1‐year and 2‐year survival for the patients with N/L < 2.5 were 92.9%, 85.7%, 42.9% and 14.3%, respectively, compared to 76.9%, 53.8%, 46.2% and 15.4% for the patients with N/L ≥ 2.5 (P = .766). C, Taking together, the survival rate was worst in the group A patients with N/L ≥ 2.5 (P < .001). The survival rates were not different among the patients in group A with N/L < 2.5, in group B with N/L < 2.5, and in group B with N/L ≥ 2.5 (P = .860)
