Figure 5.

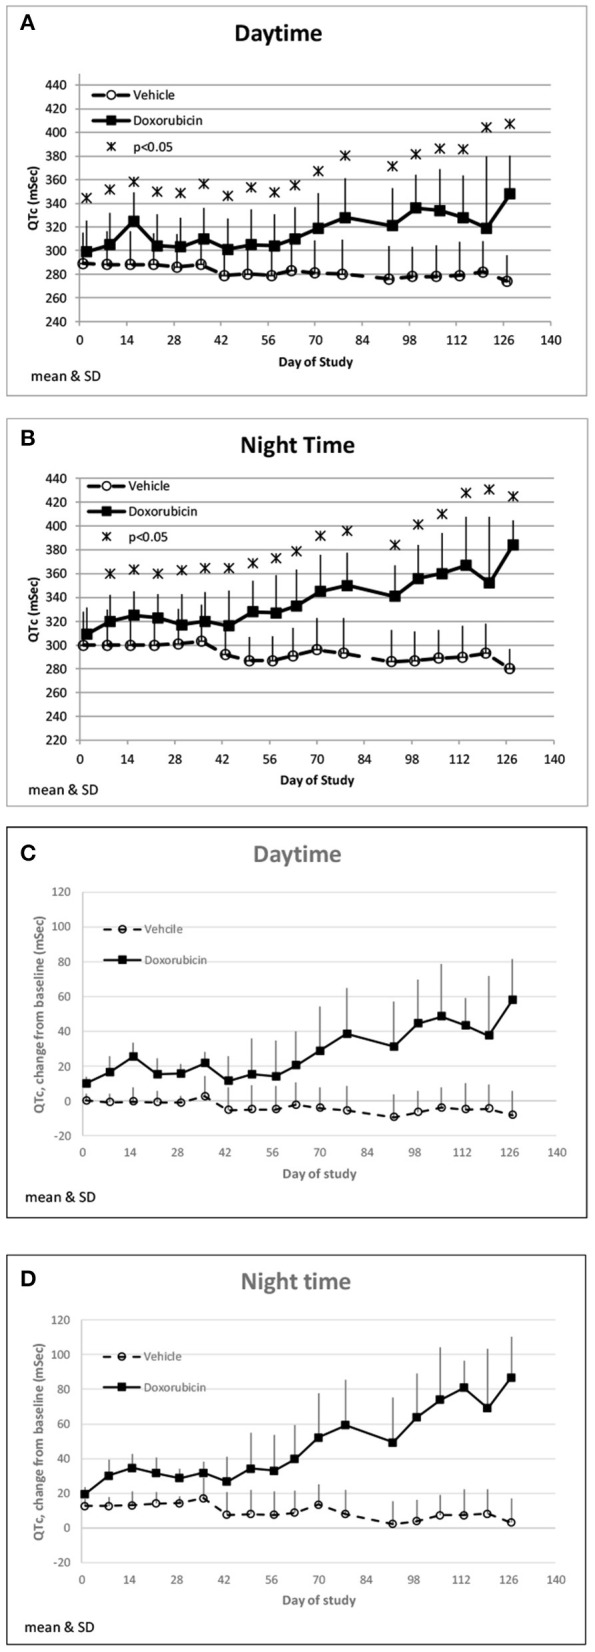
QTc changes. Changes in QTc averaged over the day (A) and night (B) time frames over the course of the study. Changes in QTc from baseline averaged over the day (C) and night (D) time frames over the course of the study.

QTc changes. Changes in QTc averaged over the day (A) and night (B) time frames over the course of the study. Changes in QTc from baseline averaged over the day (C) and night (D) time frames over the course of the study.