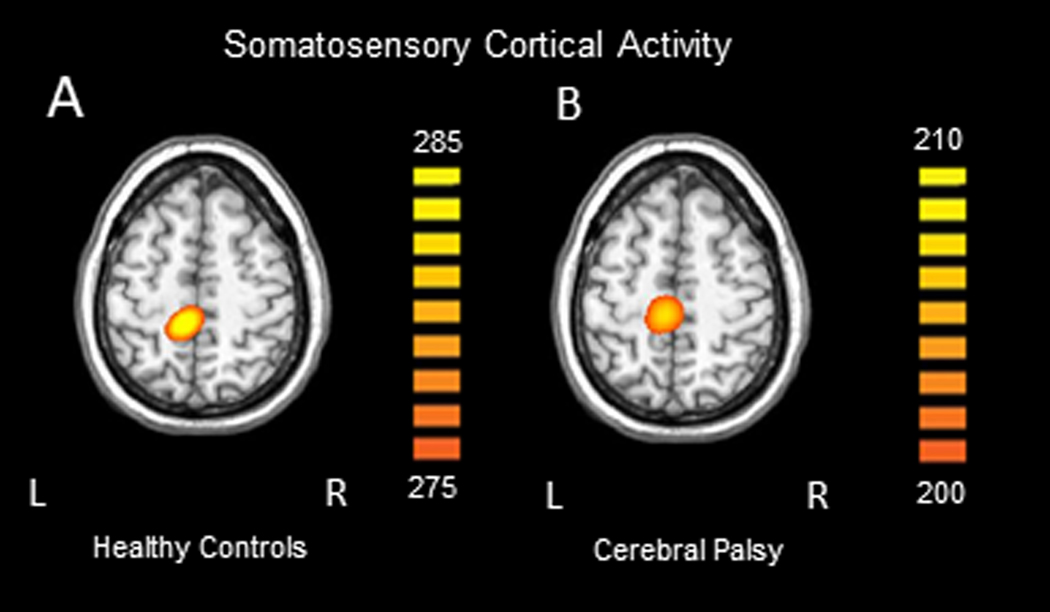
Figure 1:

Group averaged sLORETA images across the time window identified through cluster based permutation testing of the sensor level results (112 – 252ms) for the healthy controls (A) and individuals with CP (B). All responses were located in the leg region of the somatosensory cortex contralateral (left) to stimulation. Note that the units are arbitrary, and the threshold is lower for the group with CP in order to visualize the response.
