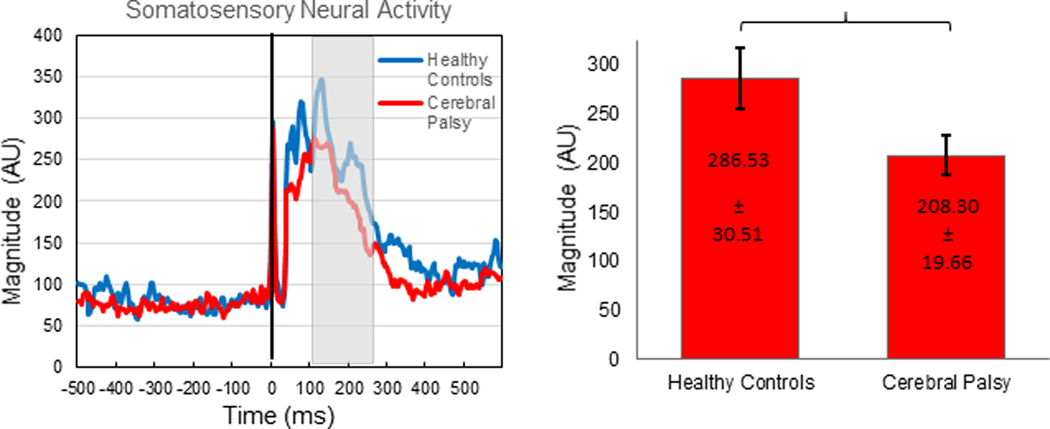
Figure 2:

Left: Peak voxel time series. The stimulus was administered at time 0.0 ms (black line). The main somatosensory response, depicted in arbitrary units (AU), begins around 40 ms and diverges group-wise shortly thereafter. The time bin containing significantly different activity relative to baseline, which was subsequently used for further imaging analysis, is demarcated by the gray box (112 – 252 ms). Blue depicts the healthy controls and red depicts the individuals with cerebral palsy. The somatosensory response was notably weaker in the individuals with cerebral palsy. Right: Bar graph representing the difference in magnitude of the response between the healthy controls and the individuals with CP. The healthy controls had a significantly stronger response than the individuals with CP (P = 0.0126).
