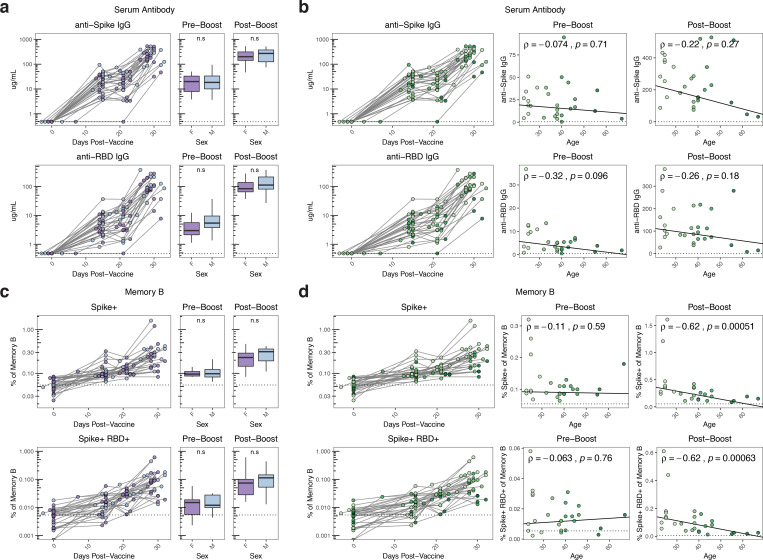
Figure 3. Age-associated decreases in antigen-specific B cell responses following mRNA vaccination.
A, B) Concentration of anti-spike and anti-RBD IgG antibodies over time compared with sex and age in SARS-CoV2 naïve individuals. Dotted lines indicate the limit of detection for the assay. C, D) Frequency of spike+ and spike+/RBD+ memory B cells over time compared with sex and age in SARS-CoV2 naïve individuals. Data are represented as frequency of spike+ and spike+/RBD+ cells in the total memory B cell compartment. Pre-boost indicates samples collected at timepoint 2 (~15 days post-primary vaccination). Post-boost indicates samples collected at timepoint 4 (~7 days post-secondary vaccination). Dotted lines indicate the mean frequency of cells at baseline. Statistics for sex were calculated using Wilcoxon test. Associations with age were calculated using Spearman correlation.

